Traffic is coming in. Paid campaigns are running. Organic pages are getting visits. Yet the numbers that matter stay flat because people aren't completing the action you built the site for.
That's usually the point where teams start guessing. They change headlines, move buttons, redesign pages, or add more content. A proper conversion rate optimisation audit stops that cycle. It gives you a working diagnosis before you spend design or development time on the wrong fix.
At Ascendly Marketing, the audit starts with a simple rule. We don't treat conversion problems as isolated page issues. We treat them as journey issues. A weak result on a pricing page, product page, lead form, or checkout flow usually comes from a broken sequence of intent, clarity, friction, and trust. The audit has to connect those pieces.
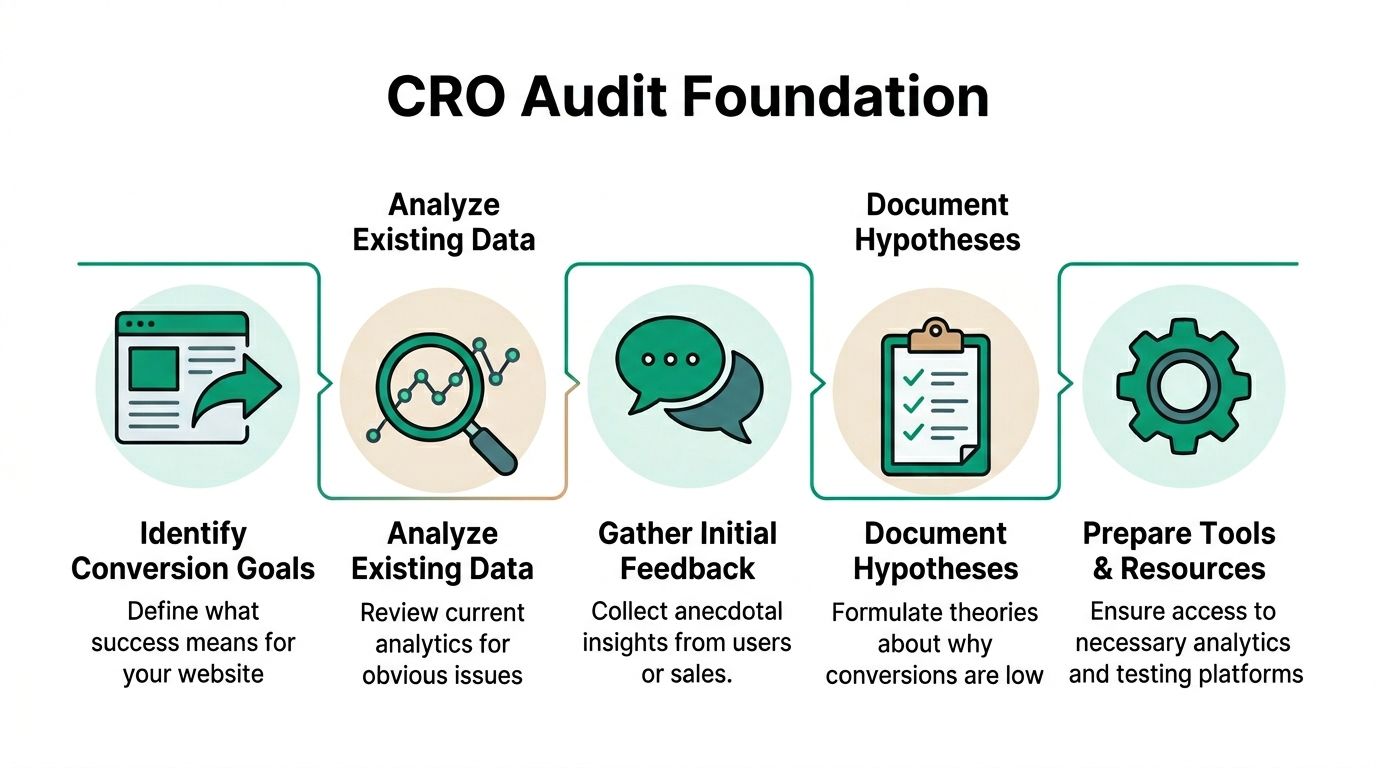
Laying the Groundwork for Your CRO Audit
Most sites don't have a traffic problem first. They have a definition problem. If five teams answer the question “what counts as a conversion?” in five different ways, the audit will drift before it starts.
Set one primary conversion goal for the audit. Choose the action that maps directly to revenue or qualified pipeline. For a B2B site, that might be a demo request or a contact form submission. For ecommerce, it's usually completed purchase. For SaaS, it may be trial signup. Matomo's CRO audit framework recommends starting with a measurable conversion goal, then reviewing analytics, behavioral evidence, form friction, and funnel drop-off points in sequence, rather than jumping straight into design changes in its stepwise CRO audit framework.
Choose the KPI before you touch the data
A clean audit starts with a question like this:
Primary KPI: What single action matters most right now?
Conversion scope: Which pages and steps influence that action?
Visitor scope: Are you auditing all traffic, or only high-intent traffic?
Success window: What does a completed conversion look like in your analytics setup?
When teams skip this, they mix micro-actions with business outcomes. Scroll depth, time on page, and CTA clicks can help explain behavior, but they don't replace the main KPI.
Practical rule: One audit. One main conversion goal. Everything else supports diagnosis.
The tool stack comes next. Don't open dashboards just to browse. Confirm access and tracking first. You need analytics for page and funnel performance, behavior tools for observation, and some form of feedback capture. In practice, that usually means a web analytics platform, heatmaps, session recordings, surveys, and direct sales or support feedback. UXCam and other modern CRO frameworks treat objective setting, behavioral data collection, funnel analysis, voice-of-customer feedback, testing, and iteration as one connected process in a repeatable CRO audit cycle.
Build the audit around evidence, not opinions
Before reviewing any page, check four things:
Analytics integrity: Conversion events, thank-you pages, or purchase events must fire correctly.
Channel labeling: Traffic source data needs to be clean enough for segmentation later.
Behavior capture: Heatmaps and session replays should already be collecting data on priority pages.
Internal context: Ask sales, support, or account teams where prospects hesitate most.
That last point gets ignored too often. If sales repeatedly hears “I couldn't tell what happens after I book” or “the pricing page confused me,” that's not proof. But it is a useful starting signal.
If you want a broader planning resource before the audit begins, Quikly's guide to modern ecommerce conversion optimization is worth reading because it frames optimisation as a system, not a collection of isolated tweaks.
Uncovering Problems with Quantitative Data
Once the goal is fixed, the next step is blunt. Find where users leave.
That means funnel analysis first, not page decoration. The pages with the highest abandonment deserve attention before pages with lower stakes. Across major CRO guidance, teams are told to map the funnel, identify exit routes, and focus testing on the biggest friction points. Power Digital also cites a global average website conversion rate of 3.68%, with top-performing websites at 11% or higher, while ecommerce references often place typical conversion rates in the 1% to 4% range in its CRO audit guide and benchmark discussion.
Start with the funnel, not the homepage
In Google Analytics 4, I'd usually begin with Funnel Exploration and Path Exploration. On other analytics platforms, the labels differ, but the task is the same. You need to see the sequence from entry page to conversion and isolate the exact step where completion breaks down.
For an ecommerce checkout flow, the core path often looks like this:
Form abandonment, field interaction, validation errors
Payment step
Drop-off after payment selection, retries, exits
Thank-you page
Confirm final conversion tracking
A common mistake is treating checkout as one block. It isn't. If the largest drop occurs between cart and checkout, that suggests a different issue than a drop between payment and confirmation.
Segmentation changes the diagnosis
Raw averages blur the problem. Segment by traffic source, device type, and key landing pages. VWO highlights traffic-source segmentation and funnel visualization because weak performance often comes from a specific mismatch between channel intent and page experience, not from the entire site.
Here's a practical example. Paid search traffic may convert poorly on mobile while direct traffic performs fine on desktop. That doesn't mean your whole checkout is broken. It may mean the mobile landing page sets the wrong expectation, or a page element shifts poorly on smaller screens.
Use segmentation to answer questions like these:
Source split: Does paid social underperform because the landing page doesn't match ad intent?
Device split: Does mobile show a sharper drop on forms or checkout fields?
Page split: Are exits concentrated on one pricing, product, or signup page?
New vs returning visitors: Are first-time users hesitating while return users convert cleanly?
If bounce and exit problems appear early in the session, that's often a separate issue from late-stage friction. For teams diagnosing that first layer, Ascendly's guide on how to reduce bounce rate on a website is a useful companion because it helps isolate weak message match and early-page disengagement.
The strongest audit findings usually come from one narrowed statement, not a broad complaint. “Mobile paid traffic exits on the first checkout step” is actionable. “Users don't like the site” is not.
After the funnel view, move to page-level reports. Look at landing pages, pricing pages, product pages, signup pages, and checkout steps. Compare conversion contribution against exits, bounce rate, CTR, and engagement signals. Don't collect every metric available. Pull the ones that explain movement toward or away from the primary goal.