

By the time many companies hear from a prospect, the primary buying work has already happened. Recent 2026 reporting says 80% of the buying decision is made before a seller enters (Cannonball GTM summary of 2026 buyer journey data). That number changes how a business should think about marketing, sales, and measurement.
When people ask how much of the buyer’s journey is digital, they usually want one neat percentage. The market no longer supports a single neat answer. The old benchmark was useful. The current one is more demanding. Buyers now research, compare, validate, and often eliminate vendors before any form fill, call, or demo request shows up in a CRM.
That shift affects B2B firms, ecommerce brands, and local service companies in different ways. It also changes what “being visible” means. Search still matters. Reviews matter. Social discovery matters. AI answers now shape shortlists too.
The Modern Customer Is Already Shopping
A buyer does not start shopping when they contact your company. They start when they search, ask peers, read reviews, compare options, and use AI tools to reduce uncertainty.
That is the digital buyer’s journey in practical terms. It is not just website browsing. It includes the research and evaluation work that happens before sales gets a chance to speak.
For a business owner, this means three things.
- Research starts earlier than most pipelines show. Buyers can spend weeks or months learning before they identify themselves.
- Your competitors are present before you know an opportunity exists. Review platforms, search results, social posts, and AI-generated summaries all shape first impressions.
- Sales inherits a market that marketing has already influenced. When a prospect finally reaches out, they often arrive with a shortlist, assumptions, and a preferred vendor.
The hidden part is what makes this difficult. A person may visit your site, leave, ask colleagues for opinions in a private Slack channel, search your brand later, compare you with two alternatives, and only then request a proposal. Most of that sequence remains invisible unless you know where to look.
Buyers do not move from awareness to decision in a straight line. They loop between channels, gather proof from outside your site, and narrow choices long before they speak with you.
That is why the old division between “brand marketing” and “lead generation” breaks down. A blog post, a Google Business Profile, a category page, a YouTube review, and a comparison article can all influence the same deal.
The hard part is not accepting that digital matters. The hard part is accepting that digital now carries much of the burden once assigned to sales conversations.
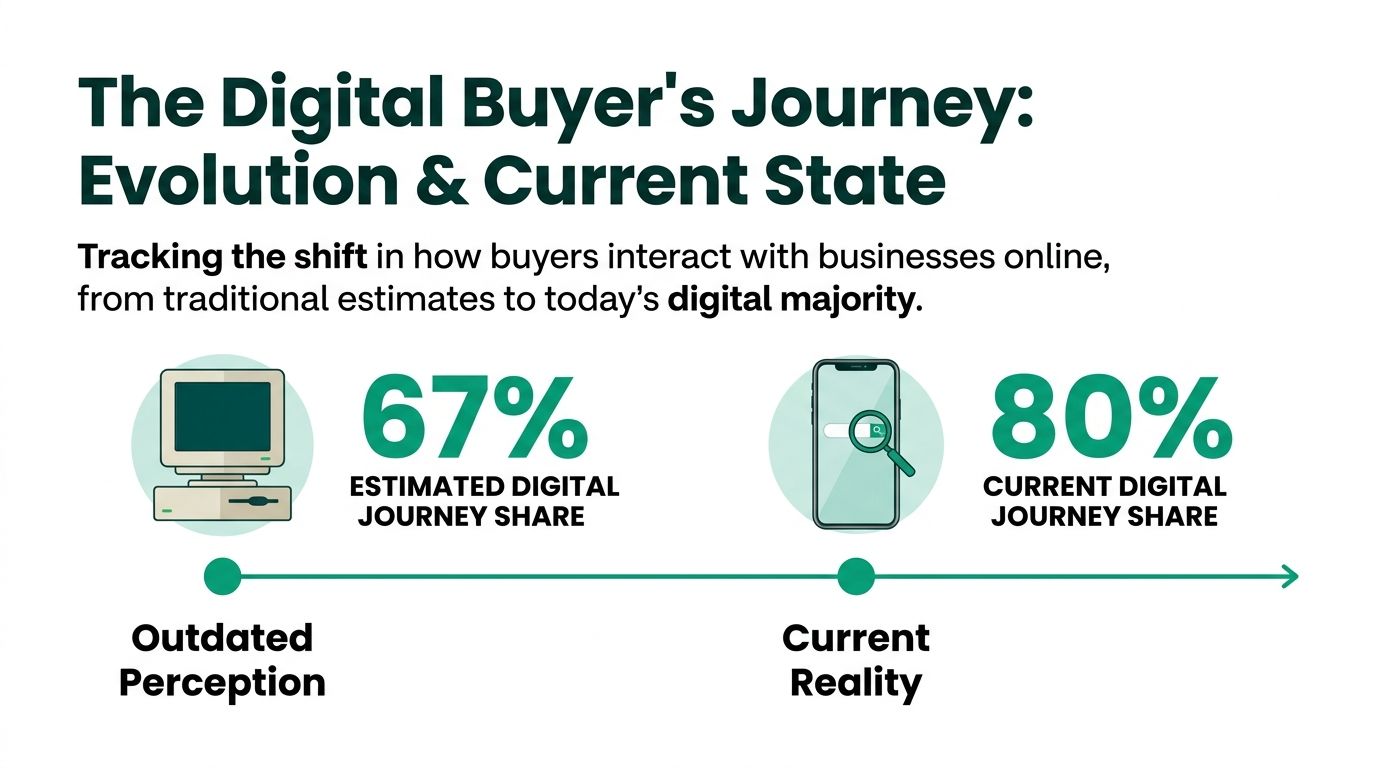
From 67 Percent to the New 80 Percent Digital Majority
67% became the headline number because it captured a real shift in buyer behavior. It no longer sets the right baseline for 2026 planning.
The original figure came from a 2013 Forrester and SiriusDecisions benchmark, later summarized by secondary sources as the share of the buyer journey completed digitally before direct vendor contact. It worked as an early warning to sales-led organizations. It is now better read as a historical marker than a current operating assumption.
Why the 67 percent figure no longer describes the market
Forrester later revisited the claim and argued that the market had moved beyond the simplified version many marketers kept repeating. In its review of the statistics, Forrester said more current buying behavior pointed closer to 70% to 80% of the journey being self-directed and noted that 80% of B2B interactions occur on third-party sites before a vendor has meaningful influence (Forrester on myths around the 67 percent statistic).
That revision matters because it changes the management question. Business owners no longer need to ask whether digital influences the journey. The more useful question is whether their company shows up consistently across the channels buyers use to reduce risk before speaking to sales.
Several other benchmarks support that broader shift. Google has reported that buyers often complete a majority of the purchase process before outreach. Gartner has found that B2B buying time is heavily concentrated in independent research and internal group discussion. Taken together, those findings point to the same operational reality. Buyers spend large portions of the journey gathering evidence without a salesperson present.
The important update is not just the higher percentage. It is the wider distribution of influence.
A decade ago, digital research often meant a search query and a visit to a vendor site. In 2026, it includes search, review platforms, analyst content, marketplaces, social proof, peer discussion, and AI-generated summaries. If you need a clearer picture of which channels deserve budget, a practical breakdown of digital marketing channels that drive SMB growth becomes useful.
What pushed the number upward
Three forces expanded the digital share of the journey.
First, buyers gained faster access to independent information. Product comparisons, customer reviews, and category education are easier to find than they were when the 67% figure first circulated.
Second, buying became more committee-driven in B2B. More stakeholders mean more internal validation, more shared links, and more time spent reviewing outside sources before anyone invites a seller into the process.
Third, AI changed the shape of research. Buyers can now compress hours of comparison into minutes by asking AI tools to summarize vendors, explain tradeoffs, and surface alternatives. That does not remove human judgment. It changes where that judgment starts. A company that is absent from trusted digital sources may never make the shortlist.
This creates a strategic risk that many firms still underweight. Deals are often won or lost before the first meeting because buyers have already filtered the market through digital evidence. Thin category pages, weak review coverage, inconsistent positioning, or poor visibility in AI-mediated results can remove a vendor from consideration.
The move from 67% to roughly 80% reflects more than heavier digital usage. It reflects a transfer of persuasion from sales conversations to distributed, buyer-controlled research.
Mapping Digital Touchpoints Across the Funnel
Digital influence is not evenly distributed across the funnel. Buyers use different channels for different jobs, and the mix changes again when AI enters the research process. A search result, a review page, and a pricing calculator may all sit on the same website, but they solve different decision problems.
A useful way to map the journey is to ask what the buyer needs to resolve at each stage: identify the problem, compare options, and reduce purchase risk.
Awareness touchpoints
Early in the journey, buyers are often trying to frame the problem before they can evaluate solutions. They search in plain language, browse social content, ask peers, and increasingly use AI tools to summarize a category before they visit a vendor site. As noted earlier, research from Google and Gartner points to a buying process that is already heavily shaped before direct outreach begins.
Common awareness touchpoints include:
- Organic search results that answer symptom-level or category-entry questions
- Paid search ads tied to high-intent problem or solution queries
- Social posts and short-form videos that introduce a need, use case, or trend
- Directory listings and map results for local and service-based firms
- AI-generated answers that condense definitions, options, and brand mentions into a short summary
This stage is where many firms lose visibility without realizing it. If your digital presence only reflects bottom-funnel sales language, you miss buyers who are still defining the problem in their own words.
Consideration touchpoints
Consideration is where digital research becomes more evaluative. Buyers are no longer asking what a category is. They are asking which approach fits their constraints, who looks credible, and what tradeoffs come with each option.
The touchpoints here tend to be richer and more comparative:
- Review platforms and third-party comparison sites
- Articles and guides that explain tradeoffs, costs, and fit
- Webinars and recorded demos
- Comparison pages such as “A vs. B” or “software vs. agency”
- Implementation content that explains onboarding, timelines, or internal effort
- Peer discussion channels such as LinkedIn comments, private communities, Slack groups, and direct messages
For SMBs, this is often the gap. The business may have brand pages and service pages, but little content that helps a buyer evaluate alternatives with confidence. That is one reason channel strategy matters more than any single asset. This overview of digital marketing channels for SMB growth is useful because it shows how search, content, social, email, and paid media support the same decision process from different angles.
AI is changing this stage faster than the others. Buyers can now compress a broad comparison set into a few prompts. That raises the value of clear positioning, third-party proof, structured product information, and content that states tradeoffs plainly. If your materials are vague, AI systems will often flatten your differentiation along with everyone else’s.
Decision touchpoints
By the decision stage, the buyer is testing execution risk. The questions become concrete. What will this cost? How hard is implementation? Has this company solved a similar problem before? What happens after the sale?
The strongest digital touchpoints at this point are usually:
- Pricing pages or pricing guidance
- Case studies and portfolio examples
- FAQ pages
- Product detail or service detail pages
- Contact forms and booking flows
- Live chat or chatbot interactions
- Free trials, samples, or consultations, where relevant
The final transaction may still happen through a sales call, a checkout page, or a proposal email. The confidence behind that action is usually assembled across earlier digital interactions, then confirmed by these late-stage assets.
Digital touchpoints by funnel stage and business type
| Funnel Stage | Common Digital Touchpoints | B2B Example | Ecommerce Example |
|---|---|---|---|
| Awareness | Search results, paid ads, social discovery, AI answers, directory listings | A buyer searches for a workflow issue and finds an educational article, analyst commentary, or practitioner post | A shopper discovers a product category through Google, Instagram, TikTok, or an AI shopping summary |
| Consideration | Review sites, articles, webinars, comparison pages, email nurture | A team compares vendors using implementation guides, review platforms, and recorded demos shared internally | A shopper compares products through reviews, creator content, feature pages, and merchant policies |
| Decision | Pricing pages, case studies, FAQs, checkout or form flow, chat | A buying group checks proof, process, security, and fit before requesting a proposal | A shopper evaluates shipping, returns, delivery timing, reviews, and checkout clarity before purchase |
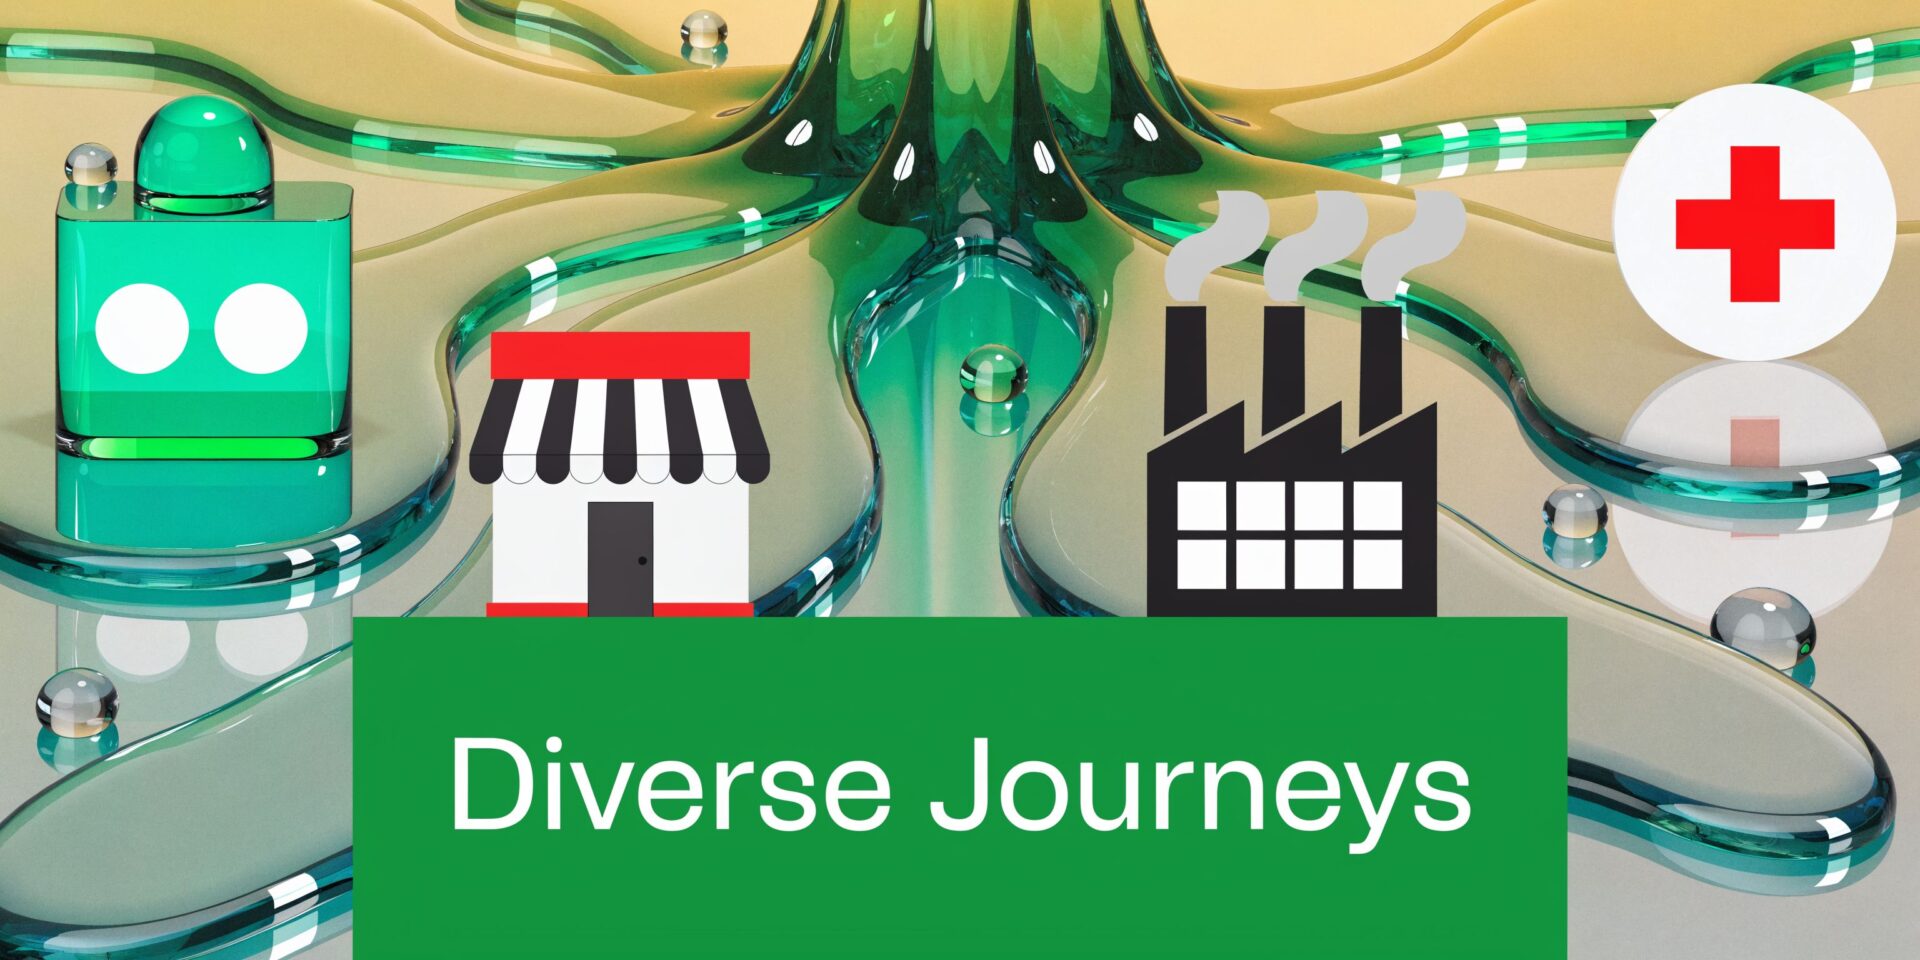
How the Digital Journey Varies by Business Type
Not every business should interpret the same headline number in the same way. A software firm with a long buying cycle and a committee-driven sale faces a very different digital journey than an ecommerce retailer selling lower-friction products.
B2B buyers do more research before contact
The strongest verified evidence sits in B2B. In the modern B2B buyer’s journey, 80% occurs digitally without direct sales involvement; buyers consult an average of 10 digital sources, buying cycles average 11.3 months, and 81% of buyers have already chosen a preferred vendor before first contact (Brixon Group summary).
That set of numbers reveals something many firms miss. B2B marketing is not just demand capture. It is preference formation.
A B2B buyer may read product pages, review sites, articles from analysts, LinkedIn posts from practitioners, and implementation-focused content before filling out a demo form. By the time a rep speaks to them, the vendor is often being validated, not discovered.
That is why narrow expertise pages can matter so much. A local service niche shows the same pattern in a smaller market. For example, a business trying to improve SEO for HVAC contractors is not solely trying to rank for one service term. It is trying to appear credible wherever a buyer checks for proof.
E-commerce buyers move faster but still research heavily
E-commerce journeys usually look shorter. They are often more visual, more price-transparent, and more influenced by reviews, creator content, shipping terms, and return policies.
The path can still be complex. A shopper may discover a product on social, search Google for alternatives, read reviews, visit the site on mobile, abandon cart, return later on desktop, and finally buy after checking user photos or FAQs. That is a digital journey too, even if no sales rep ever enters the process.
The difference is not that e-commerce is “more digital” and B2B is “less digital.” The difference is where uncertainty sits.
- In B2B, uncertainty often involves risk, implementation, consensus, and long-term fit.
- In e-commerce, uncertainty often involves product quality, price, trust, delivery, and ease of return.
This video gives a useful visual framing of how those paths diverge in practice.
What business owners should take from the contrast
A B2B company should invest more heavily in proof and education that supports multiple stakeholders. An e-commerce brand should remove friction from discovery through checkout and strengthen social proof at every step.
Both need strong digital visibility. They just need it in different forms.
If your sale depends on committee approval, your digital presence must answer several people at once. If your sale depends on convenience and confidence, your digital presence must remove hesitation fast.
Strategic Implications for Your Marketing Mix
Once you accept that much of the buyer’s journey happens digitally, channel planning changes. You stop treating SEO, paid media, content, and conversion optimization as separate programs. They become parts of one evidence system.
A second change follows. You stop assuming that all digital influence is measurable.
The verified data notes that digital activity varies across industries and that while B2B digital interactions hit 80%, a meaningful share happens in a dark funnel where buyers hold peer discussions offline or in private channels. In those cases, 22% of the time is spent in peer discussions, which can reduce the visible impact of standard PPC and SEO reporting (Content Conquered summary).
SEO shifts from rankings to coverage
SEO still matters, but not as a narrow exercise in ranking a handful of keywords.
A modern SEO program needs:
- Topic coverage that answers early, mid, and late-stage questions
- Comparison content for buyers narrowing options
- Clear service and product pages that support decision-stage confidence
- Structured, concise explanations that AI systems can parse and summarize
A company can rank for branded terms and still lose if it fails to appear for category questions, alternative comparisons, and problem-led searches.
Paid media works best as reinforcement
Paid search and paid social still create value. Their role becomes more realistic when viewed through the full journey.
Paid media can:
- Intercept category demand
- Reintroduce the brand through retargeting
- Support product launches or promotions
- Put useful content in front of in-market audiences
What it cannot do alone is replace missing credibility. If a buyer clicks an ad and finds weak reviews, thin pages, or no proof of fit, the spend does not solve the underlying problem.
Content becomes sales infrastructure
Content marketing gets discussed as a top-of-funnel tactic. In practice, it supports every stage.
A useful content system includes different asset types for different moments:
- Short explainers for early questions
- Detailed guides for evaluation
- FAQs, process pages, and proof points for decision support
That is not about publishing more for the sake of volume. It is about reducing uncertainty in the order buyers experience it.
Conversion work belongs across the journey
Most firms treat conversion rate optimization as a landing page discipline. That is too narrow.
Conversion improves when businesses reduce friction across many touchpoints:
- Search snippets that match intent
- Faster, clearer category pages
- Review visibility near key decisions
- Forms that ask for less
- Follow-up flows that continue the conversation instead of restarting it
The dark funnel makes this more demanding. Buyers may hear about you in a private conversation and search for your brand later. If your branded search results, site architecture, and trust signals fail that moment, you lose a deal that analytics may never explain cleanly.
Marketing mix decisions improve when you ask one question: what evidence does a buyer need before they are comfortable moving forward, and where will they look for it?
Actionable KPIs for Measuring Digital Engagement
Last-click attribution understates how digital buying behavior works. It captures the final hand-raise, not the research, comparison, and validation that often determine whether a buyer ever reaches your form or sales team.
That measurement gap has widened as buyers spread their research across search, review platforms, marketplaces, social proof, and AI assistants. Earlier in this article, we noted that digital influence now reaches well beyond the old 67 percent benchmark. The practical implication is straightforward. If your dashboard only reports leads and closed deals, you are missing the signals that explain why those outcomes changed.
What to track before the lead form
The strongest KPIs show movement from passive attention to active evaluation.
- Branded search growth indicates whether earlier exposure is creating enough interest for buyers to look for you by name.
- Repeat visits from the same company, geography, or audience segment often signal that a purchase decision is being revisited internally.
- Multi-asset consumption separates shallow traffic from serious research. A visitor who reads a guide, checks pricing, and returns to a case study is showing a different level of intent than someone who exits after one blog post.
- High-intent page paths reveal which content combinations support decisions. Common patterns include a service page to FAQ, a comparison page to contact page, or a product page to reviews and testimonials.
These metrics matter because they reflect buyer behavior before attribution platforms can label it cleanly.
Add AI visibility to the dashboard
Search rankings still matter, but they no longer describe the full discovery process. Buyers increasingly use AI tools to compare vendors, summarize options, and narrow a shortlist before they ever visit a website.
That creates a new measurement category.
Track whether your brand appears in AI-generated responses for relevant category queries. Review whether your core pages are structured clearly enough to be summarized accurately. Monitor third-party mentions, citations, and review coverage, since AI systems often rely on information beyond your own site.
A drop in organic clicks does not always mean weaker market presence. In some cases, it means the buyer found enough information in an AI summary, directory listing, or review page to skip straight to a branded search or direct visit.
Tie engagement to financial outcomes
Executives do not need more activity metrics. They need evidence that early digital engagement leads to a qualified pipeline and revenue. A practical way to do that is to map pre-conversion signals against opportunity creation, sales velocity, and close rates. This guide on how to calculate marketing ROI is useful because it frames the core question correctly: which digital behaviors consistently show up before revenue outcomes?
For B2B firms, that often means connecting repeat visits, return sessions from target accounts, and pricing-page engagement to sales acceptance and pipeline creation. For e-commerce brands, the equivalent measures may be product-detail views, return visits, email captures, add-to-cart rate, and assisted conversions from non-brand channels. The KPI set should reflect the business model, not a generic marketing template.
A workable scorecard for many companies looks like this:
| KPI | What it tells you |
|---|---|
| Branded search trend | Whether awareness is turning into active consideration |
| Repeat visitor rate | Whether buyers are coming back to validate the purchase |
| Multi-page or multi-asset sessions | Whether research depth is increasing |
| Contact rate from high-intent pages | Whether decision-stage content supports action |
| AI and third-party visibility checks | Whether buyers can discover and assess you beyond classic search |
Companies that monitor these signals get a more accurate view of how demand forms. Companies that do not often over-credit referrals or sales relationships, even when digital research shaped the shortlist long before a conversation began.
If your business needs a clearer view of how buyers research, compare, and choose online, Ascendly Marketing can help you audit the digital journey, strengthen the channels that influence real buying decisions, and connect early engagement to measurable growth.