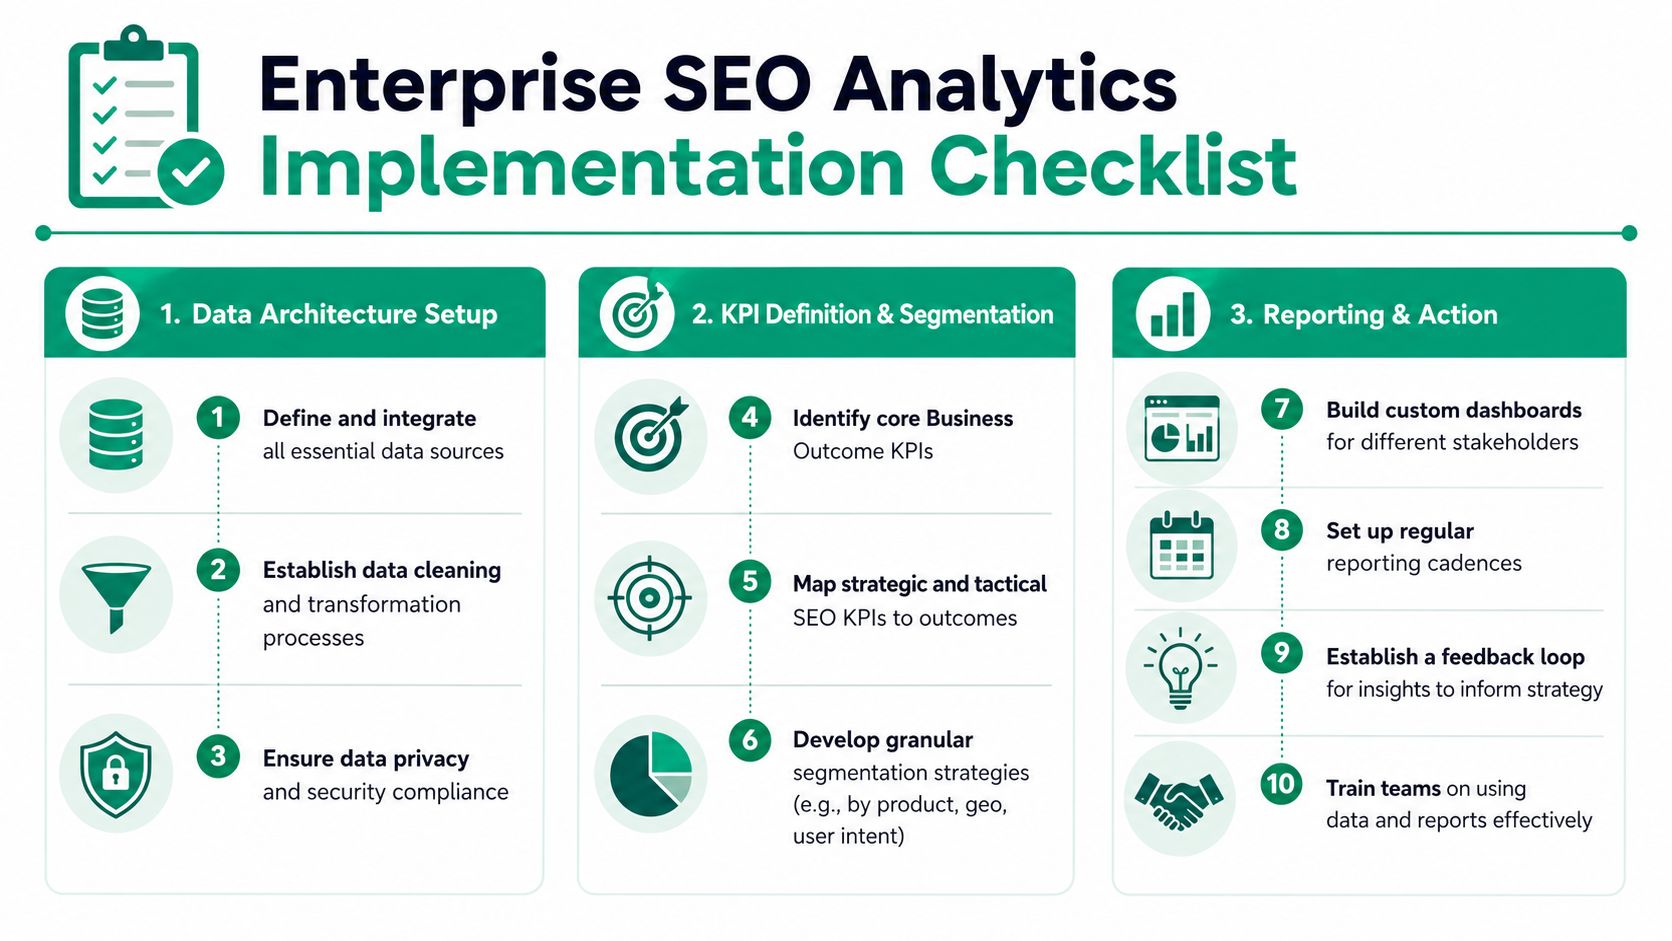

The biggest problem in enterprise SEO analytics is not dashboard coverage. It is the gap between reporting and decision-making.
Large organizations already have rank trackers, crawl data, web analytics, BI views, and exports from half a dozen platforms. What they usually lack is a system that helps teams answer three operational questions fast: what changed, why it changed, and which action deserves resources first. That is the difference between a dashboard people glance at and an analytics model that influences budget, roadmap, and accountability.
At enterprise scale, that distinction matters because SEO performance rarely breaks in one place. Visibility can drop because of a template release, internal linking decay, slower indexing, market-specific demand shifts, bad attribution rules, or a change in how search surfaces content in AI-generated results. If the reporting layer cannot separate those causes, teams default to opinion, not diagnosis.
That is also why mature enterprise SEO programs are built as decision systems tied to business value, not rankings in isolation. A useful introduction to the broader operating model sits in this enterprise SEO guide for scalable success, but the analytics challenge is narrower and harder. The job is to connect technical signals, market context, and commercial outcomes in a way that works across business units and countries.
In agency work, that is usually the line between reporting that fills a monthly meeting and analytics that changes what gets fixed next.
What Enterprise SEO Analytics Truly Means
Enterprise SEO analytics starts once a dashboard stops serving as a summary and starts serving as a decision system.
Large companies rarely struggle with data access. They struggle with interpretation, ownership, and speed. The reporting exists. The gap is an operating model that helps teams determine what changed, why it changed, and what should get resources first. That standard matters even more now that organic visibility is split across classic rankings, AI-generated search features, and fragmented attribution paths across markets.
Reporting isn't the same as diagnosis
A rank tracker can confirm that visibility fell. It cannot separate a crawling problem from a template release, a drop in demand, weaker page intent match, or a measurement issue inside analytics.
That distinction changes the job of analytics. On an enterprise site, page-by-page review does not scale across business units, countries, templates, and product lines. Teams need a measurement layer that connects technical conditions to commercial outcomes so they can explain movement, not just report it.
Practical rule: If your dashboard cannot help a team choose between fixing a template, revising a page group, resolving an attribution problem, or escalating a market-specific issue, it is a reporting view, not an enterprise analytics system.
I see this mistake often in large organizations. Executive reporting and diagnostic reporting get mixed together, then neither audience gets what it needs. Leaders need a short answer on performance, cause, and next action. SEO, analytics, product, and engineering teams need enough segmentation to isolate the source of change without arguing over whose numbers are right.
A useful enterprise setup answers three questions consistently:
- What changed: Visibility, traffic, conversions, pipeline contribution, or revenue
- Why it changed: Technical defects, content gaps, changes in search features, market demand shifts, or user experience friction
- What happens next: The action, the owner, the expected impact, and the level of confidence
At this point, enterprise SEO stops being a channel report and becomes part of how the business allocates attention. The analytics layer has to reconcile competing truths. Rankings can improve while leads stay flat. Traffic can grow while qualified pipeline falls. AI Overviews can reduce clicks even when a brand still appears prominently in search. If the system cannot explain those trade-offs, teams default to opinion and politics.
The business case changes the design
Smaller programs can live with broad reporting for a while. Enterprise programs cannot. They are asked to justify investment across markets, support forecasts, and hold multiple teams accountable for outcomes they influence together.
That pressure changes what "good analytics" means. The job is not to produce more charts. The job is to create a shared measurement model for visibility, diagnosis, attribution, and prioritization across regions and business units. That is also why governance matters so much in enterprise SEO. If Germany defines conversions one way, the US another way, and the global BI team reports branded and non-branded demand differently, the dashboard may look polished while the decisions stay flawed.
If you want the broader context for how large organizations structure organic growth programs, this guide to enterprise SEO and scalable success is a useful companion. The analytics piece is narrower and harder. It has to translate search performance into decisions that finance, product, engineering, and regional marketing teams can all act on.
A clean way to frame the difference:
| View | What it tells you | What it misses |
|---|---|---|
| Basic SEO reporting | Rankings, traffic, top pages | Root cause, market variation, AI search visibility, and business impact |
| Enterprise SEO analytics | Performance, diagnosis, attribution, prioritization, and governance | Little, if the measurement model is built around decisions |
Strong enterprise teams ask for fewer metrics, tighter definitions, and clearer ownership. That is how analytics starts changing roadmaps instead of filling slides.
Designing Your Data Architecture
Most enterprise SEO analytics failures start before anyone opens a dashboard. They start in the plumbing.
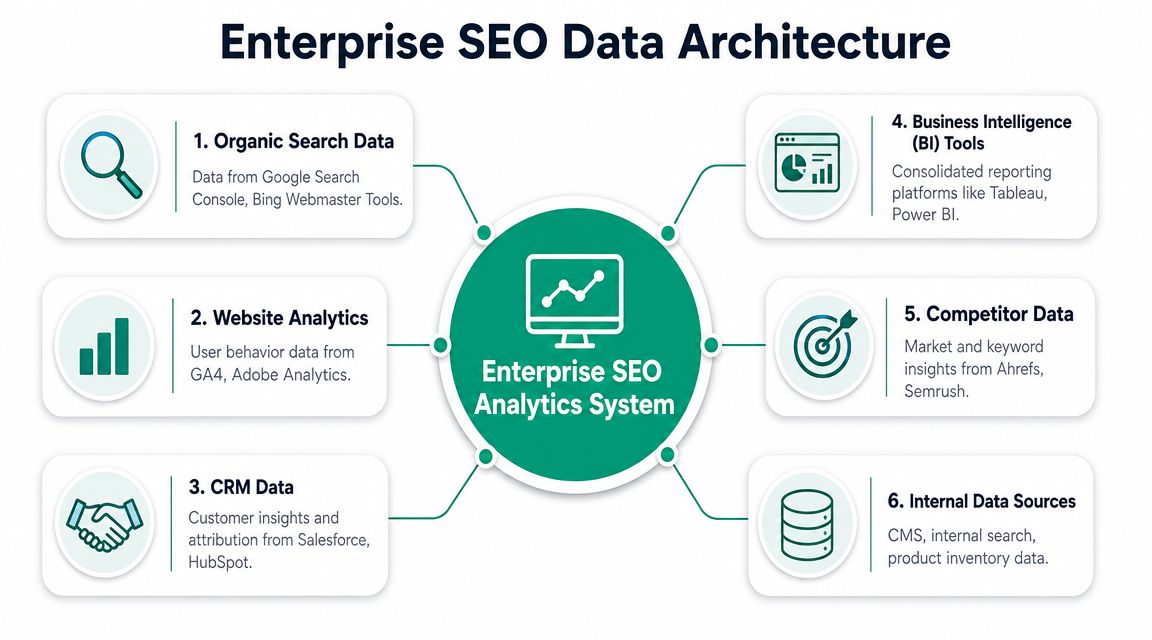
A single source of truth doesn't appear because a team bought a platform. It appears because the underlying data model forces disconnected systems to speak the same language. That means crawl data, search data, analytics data, and revenue data have to meet in one usable structure.
Start with a central measurement layer
The practical goal is simple. When traffic moves, the team should be able to trace the cause without jumping across six tools and three spreadsheets.
That only works when crawl, keyword, behavioral, and revenue data are unified into one measurement layer. Siteimprove describes the operational value clearly in its piece on using analytics to measure the business impact of SEO: teams can detect a drop or spike in Google Search Console, diagnose it with crawl data plus GA behavior, and then validate the fix by tracking pipeline impact over the next 30–60 days.
In practice, I want these data families connected:
- Search performance data from Google Search Console and similar sources
- Behavioral analytics from GA4 or Adobe Analytics
- Crawl data from enterprise crawlers or Screaming Frog
- Keyword and market data from platforms such as Ahrefs or Semrush
- CRM and sales data from systems like Salesforce or HubSpot
- Internal business data such as CMS fields, inventory, location data, or product status
Without that architecture, teams argue over symptoms. With it, they can isolate causes.
Diagnose the drop before you prescribe the fix
Here's the most common enterprise mistake. A traffic drop appears in Search Console, and the team immediately treats it as a ranking issue.
That assumption wastes time. The decline might be technical, behavioral, or commercial. A page set can keep ranking while generating weaker outcomes because post-click friction increased. The opposite also happens. Rankings slip slightly, but conversion quality improves because the traffic mix is better.
A good architecture doesn't just merge tools. It resolves competing explanations.
A practical workflow looks like this:
- Detect the change in Search Console by page group, query group, or market
- Check crawl and indexation signals to rule out technical failure
- Review user behavior to spot engagement or journey friction
- Validate downstream impact in the CRM or pipeline view
- Watch the fix over time instead of declaring victory on the day of deployment
A warehouse or governed BI model offers assistance. It doesn't have to be elaborate on day one, but it has to be structured. If your analytics team already uses warehousing and reporting across channels, this look at how marketing analytics drives real business growth maps well to SEO too.
What breaks most often
The weak point usually isn't collection. It's joining the data in a way that's stable enough for recurring analysis.
Three failure patterns show up repeatedly:
| Failure pattern | What happens | Result |
|---|---|---|
| Tool-by-tool reporting | Each platform reports in isolation | No root-cause diagnosis |
| Weak page mapping | Templates, folders, or markets aren't classified consistently | Segment analysis becomes unreliable |
| No revenue connection | SEO metrics stop at traffic or conversions | Leadership can't judge business value |
When teams fix those three issues, the rest of the architecture becomes much easier to defend and expand.
Prioritizing KPIs and Strategic Segmentation
Enterprise teams rarely fail because they lack metrics. They fail because they give every metric equal weight.
A reporting model has to reflect how decisions get made. Executives need to know whether SEO is increasing revenue, pipeline, or qualified demand. Channel leaders need to know which markets, product lines, and search themes are gaining or losing ground. Practitioners need enough diagnostic detail to explain the movement and choose the next action. If those layers get mixed together, leadership gets flooded with noise and specialists lose the context that makes the noise useful.
Build a KPI hierarchy that matches decisions
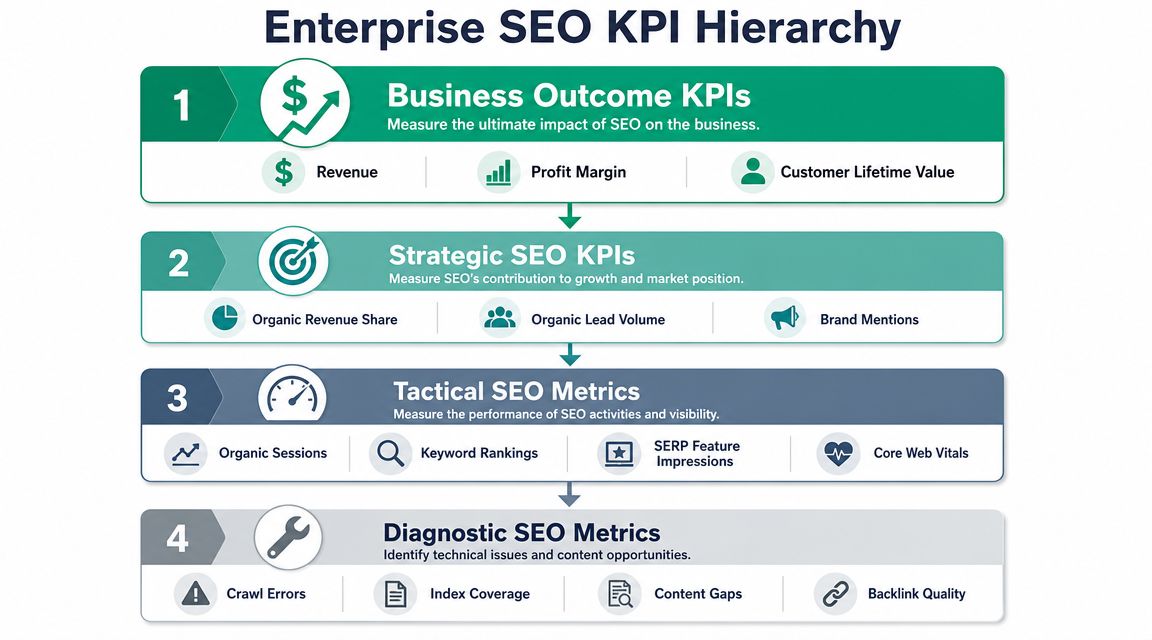
I use four levels.
At the top are business outcome KPIs such as revenue influence, pipeline contribution, qualified lead volume, or retained customer value where SEO supports expansion or self-service journeys. Below that sit strategic SEO KPIs, which show whether the program is winning in the places that matter most, such as non-brand visibility by market, product-line growth, or share of organic conversions by region. The third layer is tactical performance, where teams monitor landing-page trends, query groups, session quality, and conversion rates. The bottom layer holds diagnostic metrics such as crawl status, indexation patterns, Core Web Vitals by template, and internal linking coverage.
This hierarchy does more than clean up reporting. It protects prioritization.
For example, a rise in rankings on low-value informational content can make a dashboard look healthy while pipeline from commercial page groups declines. A mature analytics system catches that mismatch early because outcome KPIs and strategic segments sit above traffic metrics. That is the difference between an SEO dashboard and a decision system.
Segment by operating unit, not just by URL
Sitewide averages are the fastest way to misread an enterprise site.
Large sites are collections of templates, business units, markets, devices, and user journeys. Performance issues rarely hit all of them evenly. American Eagle's enterprise SEO audit guidance makes this point clearly in practice. Technical auditing works better when Core Web Vitals and related checks such as TTFB, FCP, LCP, and TBT are reviewed by page type, because many problems come from a specific template or rendering pattern rather than the whole domain.
That changes how teams should report. A category template with poor LCP can suppress a major commerce segment while editorial content remains stable. A location-page framework can struggle with indexation while national service pages grow. Mobile can underperform in one market because of translation or layout issues, while desktop trends make the blended average look acceptable.
Useful segmentation usually includes:
- Page type such as category, product, blog, help center, location, or comparison pages
- Business unit for organizations with multiple product lines or service areas
- Market and locale because search behavior, SERP features, and conversion paths vary by country
- Device class because mobile losses often disappear inside blended reporting
- Journey stage so discovery content, evaluation pages, and conversion pages are measured against the right outcome
- Search surface including classic blue-link rankings, local visibility, and AI-generated answer exposure where relevant
That last segment matters more than many teams expect. If AI Overviews reduce clicks on some query classes, the right question is not only whether traffic dropped. The key question is which intent groups still drive visits, which groups now deliver visibility without clicks, and where that shift changes content investment. Segmenting by query intent and search surface makes that visible before the team overreacts to headline traffic numbers.
Working principle: If reporting stays at the domain level, teams usually fix the loudest issue, not the issue with the highest business impact.
Template-level gains usually beat page-by-page fixes
Enterprise SEO rewards scale effects.
One template improvement can change thousands of URLs. One faulty component can suppress thousands just as quickly. That is why segmentation is not a reporting preference. It is how teams identify whether the next hour should go toward engineering, content, internal linking, localization, or measurement cleanup.
A practical example: if non-brand visibility drops in Germany on mobile for product-detail pages, and conversion rate also slips for that same segment, the likely priority is not another round of copy edits across the blog. It is a page-type and market-specific diagnosis. Often that means rendering, speed, schema, faceted navigation, or localized template logic. Without segmentation, those issues get buried inside global averages and the team spends the quarter fixing the wrong layer.
Here is a KPI mapping model I use to keep that separation clear:
| KPI level | Example questions | Example metric types |
|---|---|---|
| Business outcome | Did SEO influence revenue or pipeline? | Revenue, qualified leads, pipeline contribution |
| Strategic | Which markets, product lines, or search surfaces are gaining ground? | Visibility by market, non-brand share, organic conversions by business unit |
| Tactical | Where is traffic or engagement changing? | Sessions, landing-page trends, query groups, template performance |
| Diagnostic | What caused the movement? | Crawl issues, CWV by template, indexation patterns, internal link coverage |
Teams that need a simpler baseline before building this hierarchy can start with the core concepts in SEO reporting fundamentals. Enterprise analytics adds governance, attribution, market segmentation, and now AI visibility measurement on top of that base.
Building Your Enterprise Analytics Tech Stack
Tech stack decisions fail when procurement leads and measurement design follows. In enterprise SEO, the stack has to support decisions across three speeds at once: daily diagnosis for practitioners, monthly performance reporting for directors, and audited business reporting for finance and leadership. One platform rarely serves all three well.
That is why mature programs stack systems by role, not by vendor category.
The stack categories that matter
Four tool layers show up in nearly every enterprise setup, even if the brand mix changes.
| Tool Category | Core Function | Examples | Best For |
|---|---|---|---|
| Enterprise SEO platforms | Crawl data, rank tracking, auditing, market visibility | BrightEdge, Conductor, Siteimprove | SEO teams that need operational workflows and monitoring in one place |
| Web analytics platforms | User behavior and conversion analysis | GA4, Adobe Analytics | Teams diagnosing what happens after the click |
| BI and visualization tools | Shared reporting and stakeholder dashboards | Tableau, Power BI, Looker Studio | Cross-functional reporting and executive summaries |
| Data storage and integration | Central modeling, joins, and historical reporting | Google BigQuery, Snowflake, APIs, ETL connectors | Organizations that need governed data across SEO, CRM, and finance |
Each layer solves a different problem. Rank data explains search presence. Web analytics explains visits and behavior. A warehouse and BI layer make it possible to join SEO with pipeline, revenue, market ownership, and product-line reporting. That last piece matters more than many teams expect, especially once leadership asks for one version of truth across regions.
Buy, build, or hybrid
The trade-off is not simplicity versus sophistication. It is speed versus control, and every enterprise has to decide where it can tolerate constraints.
An all-in-one platform is faster to procure and easier to roll out across a distributed team. It usually gives SEO managers a workable home for crawls, rankings, alerts, and task management. The limitation appears later, when the business needs custom attribution logic, regional governance rules, or joins to CRM and finance data that sit outside the vendor's default model.
A custom stack gives analysts far more control over definitions and modeling. It also creates ongoing maintenance. Connectors break. APIs change. Ownership gets fuzzy if engineering, analytics, and SEO all assume someone else is watching the pipeline.
For large organizations, a hybrid model is usually the practical answer. Use a dedicated SEO platform for operational work. Use the warehouse and BI layer for executive reporting, attribution, and cross-market comparisons. That keeps specialists close to the diagnostics while giving leadership reporting they can trust.
It also puts the hard decisions in the right place. Teams can examine Optimizing for AI Overviews inside the measurement model instead of forcing new search surfaces into an old dashboard structure.
What should drive the decision
Feature checklists are a weak buying framework. These questions produce better stack decisions:
- Who owns the data model? If no team can maintain SQL logic, API ingestion, or metric definitions, a custom environment will decay fast.
- How many reporting audiences exist? A stack that works for SEO managers may fail with finance, regional leadership, or product teams.
- How complex is attribution? If SEO needs to connect with pipeline, assisted conversions, or offline sales, the BI layer needs direct access to governed source data.
- How many markets are in scope? Multi-country programs need standard definitions for brand, non-brand, page types, and conversion events, or comparisons become unreliable.
- How quickly do teams need answers? Fast issue detection belongs in operational tools. Board-ready reporting belongs in a modeled reporting environment.
I also evaluate handoffs. If SEO works in one interface, analytics in another, and leadership in slide decks, the stack needs a clean reporting chain between those systems. Without that chain, teams waste time translating screenshots into business language.
The strongest stack keeps diagnostic work close to practitioners and business reporting stable enough to survive executive scrutiny.
What breaks in practice
Three patterns create problems again and again.
The first is treating rank-tracking software as the analytics system. Rank tools are useful inputs, but they do not resolve attribution, market governance, or cross-channel impact.
The second is pushing executive reporting straight out of SEO tooling. That usually produces too much tactical detail and too little business context. Leadership does not need a list of keyword movements by device. Leadership needs to know which market, template, or product area changed, why it changed, and what action follows.
The third is allowing each region or department to define success differently. One market counts form fills. Another counts MQLs. Another reports sessions. At that point, enterprise SEO analytics stops being a measurement system and becomes a debate about whose dashboard is "right."
A mature stack reduces that drift. Beyond that, it gives the organization a reliable way to move from signal to action across markets, channels, and search surfaces.
Measuring Visibility in the Age of AI
Traditional enterprise SEO analytics was built around rankings, clicks, and landing-page performance. That model still matters, but it no longer covers the whole field.
Search behavior is shifting toward AI-generated answers, AI Overviews, and answer engines that may mention a brand without sending a click. That creates a measurement gap. A team can gain visibility and lose traffic at the same time.

Rankings alone won't describe the outcome
One of the more useful recent questions in this space is this: what KPI mix should an enterprise use when clicks decline even as citation or mention visibility rises?
That issue is now being addressed more directly. Industry guidance highlighted by LLMrefs on enterprise SEO analytics recommends tracking AI answer engine visibility alongside regional visibility and ownership by market. The implication is clear. Enterprise SEO analytics now needs a dual-layer model, not a simple rank tracker.
That changes how teams read performance.
A ranking improvement in classic search may not produce proportional traffic if AI surfaces absorb the answer. At the same time, a brand mention inside an AI-generated result may still support awareness, product recall, or later navigation. If the analytics model only rewards clicks, it will understate part of the visibility picture.
Use a dual-layer measurement model
The practical fix is to split reporting into two layers.
Layer one tracks traditional search performance. That includes search visibility, landing-page trends, branded and non-branded traffic patterns, and downstream conversion signals.
Layer two tracks AI surface presence. That means monitoring whether the brand, product, category pages, or owned entities appear in answer engines and AI-generated summaries, and whether that presence changes by market.
A useful operating view often includes:
- AI answer engine visibility by topic or query group
- Brand and product citations across AI-generated answers
- Ownership by market so regional teams can see where coverage is strong or weak
- Classic SERP visibility alongside AI surface presence, not instead of it
If you're building out process around this area, Raven SEO's piece on Optimizing for AI Overviews is a worthwhile reference because it focuses on the measurement side, not just content tactics.
This short video is also useful context for teams adapting their analytics model: