

TL;DR:
- Website analytics enables businesses to track user behavior and optimize online performance through key metrics and data analysis. Combining quantitative and qualitative insights helps diagnose issues effectively, guiding targeted improvements across funnels and channels. Consistent measurement, planning, and review practices lead to measurable increases in conversions, marketing efficiency, and decision speed.
Website analytics is the practice of collecting, measuring, and analyzing web data so businesses can understand user behavior and optimize their online performance. The industry standard term for this discipline is web analytics, and it covers everything from traffic sources to conversion paths. Tools like Google Analytics 4, Hotjar, and Mixpanel have made this data accessible to businesses of every size. When used with intention, web analytics transforms raw numbers into decisions that improve marketing ROI, increase conversions, and sharpen the user experience across every page of your site.
What is the role of website analytics in measuring performance?
Web analytics serves four core functions: traffic analysis, user behavior tracking, conversion measurement, and technical performance monitoring. Each function answers a different business question, and together they give you a complete picture of how your site is working.

Traffic analysis tells you where visitors come from. Organic search, paid ads, social media, direct visits, and referral links each represent a different acquisition channel. Knowing which channels drive the most qualified traffic lets you allocate budget with precision rather than guessing.
User behavior tracking follows what visitors do after they arrive. Navigation paths, scroll depth, time on page, and exit points reveal whether your content is holding attention or losing people before they reach a call to action.
Conversion tracking measures whether visitors complete the actions that matter to your business. Form submissions, purchases, phone calls, and downloads are all trackable events. Web analytics connects marketing spend directly to business outcomes by tracking these behaviors rather than relying on assumptions.
Performance monitoring covers technical health: page load speed, mobile responsiveness, and error rates. Slow pages kill conversions before analytics even gets a chance to measure them.
Here are the core website performance metrics every business should track:
- Sessions: Total visits to your site within a defined period
- Bounce rate: Percentage of visitors who leave after viewing only one page
- Conversion rate: Percentage of visitors who complete a target action
- Pageviews: Total number of pages viewed, including repeat views
- Average session duration: How long visitors stay on your site
| Metric | What it measures | Why it matters |
|---|---|---|
| Conversion rate | Actions completed per visit | Directly ties traffic to revenue |
| Bounce rate | Single-page exits | Signals content or UX mismatches |
| Session duration | Time spent per visit | Indicates content engagement depth |
| Traffic by channel | Source of each visit | Guides budget allocation decisions |
Pro Tip: Set up a custom dashboard in Google Analytics 4 that surfaces only your five most critical metrics. Reviewing a focused dashboard weekly beats scrolling through 40 reports monthly.
How do different types of analytics give you a fuller picture?
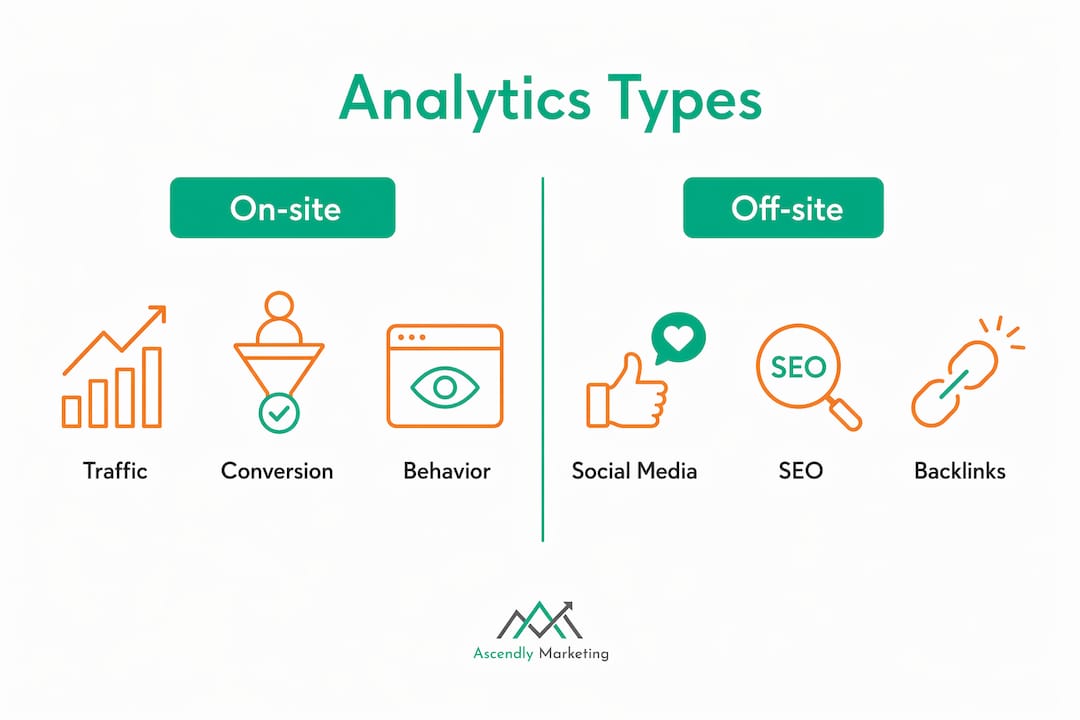
No single data source tells the whole story. Web analytics divides into two primary categories: on-site and off-site, and within those, quantitative and qualitative. Understanding the difference determines how you diagnose problems and fix them.
On-site analytics captures what happens within your own website. Google Analytics 4 and Mixpanel fall into this category. They record sessions, events, and conversion paths. Off-site analytics measures your presence and reputation beyond your domain, including social media mentions, backlink profiles, and search engine rankings tracked through tools like Google Search Console or Semrush.
Quantitative analytics gives you numbers: how many, how often, how long. Qualitative analytics explains the “why” behind those numbers. Hotjar’s heatmaps and session recordings show exactly where users click, where they stop scrolling, and where they abandon a form. That context is something a bounce rate figure alone cannot provide.
Combining both types is where the real diagnostic power lies. Imagine your checkout page shows a 70% drop-off rate in GA4. That number tells you there is a problem. A Hotjar session recording then shows users repeatedly clicking a non-functional coupon field. That combination tells you exactly what to fix. Neither tool alone would have given you the full answer.
Here is how the main analytics types compare:
| Type | Data source | Primary use case |
|---|---|---|
| Quantitative on-site | GA4, Mixpanel | Traffic volume, conversion rates, funnel analysis |
| Qualitative on-site | Hotjar, Microsoft Clarity | UX diagnosis, form friction, scroll behavior |
| Off-site analytics | Google Search Console, Semrush | SEO visibility, backlinks, brand mentions |
| Real-time analytics | GA4 real-time reports | Campaign monitoring, live event tracking |
Businesses that rely only on quantitative data often fix the wrong things. A page with a high bounce rate might be performing perfectly if visitors are finding exactly what they need and leaving satisfied. Qualitative data confirms or challenges what the numbers suggest, which is why integrating both types creates a causal optimization cycle rather than a guessing game.
What practical steps should businesses take to use analytics effectively?
Knowing which tools exist is not enough. The businesses that get real results from web analytics follow a structured process rather than logging into dashboards reactively.
Define a measurement plan before you touch any tool. A measurement plan translates business goals into specific metrics and event mappings before campaigns launch. Without this step, you end up tracking everything and acting on nothing. Identify your top three business objectives, then map each one to a specific measurable event in your analytics platform.
Set up Google Analytics 4 with proper event taxonomy. GA4 uses an event-based model where user actions are tagged as key events for reporting. Define your conversion events precisely before launch. Gaps in event mapping create incomplete data that leads to bad decisions downstream.
Build funnel analysis into your reporting. Structuring analytics around the user funnel lets you pinpoint exact drop-off stages. Measure entry, engagement, and conversion stages separately. A service business might track: landing page visits, pricing page views, contact form starts, and form submissions. Each stage gap is an optimization opportunity.
Establish a consistent review cadence. Weekly reviews of traffic and conversion data catch problems early. Monthly deep dives into funnel performance and channel attribution inform budget decisions. Quarterly audits of your measurement plan keep your tracking aligned with evolving business goals.
Connect GA4 to Google Ads. GA4 integrates with Google Ads to enable performance-driven campaign adjustments based on actual conversion data rather than click volume. This connection alone can dramatically improve paid search ROI.
For small businesses, the approach should be deliberately simpler. Tracking fewer but consistent metrics prevents analysis paralysis and enables faster decisions. Tools like Plausible and Umami offer privacy-friendly, straightforward alternatives to GA4 when simplicity matters more than feature depth. You can always find guidance on analytics-driven SMB growth to tailor this approach to your specific business size.
Pro Tip: Pick five metrics that directly connect to revenue. Ignore everything else for the first 90 days. Consistency in reviewing a small set of meaningful numbers beats occasional analysis of a sprawling report.
What business outcomes does website analytics actually deliver?
The tangible benefits of web analytics show up in four areas: conversion rates, marketing spend efficiency, user experience quality, and decision speed.
Improved conversion rates come from identifying and removing friction. An e-commerce brand that uses funnel analysis to discover that 60% of users abandon their cart at the shipping cost reveal can test free shipping thresholds and measure the direct impact. That is not intuition. That is data-driven UX optimization producing measurable revenue lift.
Smarter marketing spend follows from channel attribution. When analytics shows that organic search drives three times the conversion rate of paid social at half the cost per acquisition, the budget reallocation decision makes itself. Without that data, most businesses split spend based on habit or gut feel.
Better user experience emerges from identifying content gaps and navigation dead ends. Pages with high exit rates and low engagement signal that visitors are not finding what they expected. Fixing those pages reduces bounce rates and increases the probability that visitors move deeper into your site.
Faster decisions are the compounding benefit. Real-time data in GA4 lets you catch a broken campaign within hours rather than weeks. A service business that launches a new landing page can validate its performance within 48 hours rather than waiting for a monthly report.
“Analytics without action is just data collection. The businesses that win are the ones that build a review-and-respond rhythm into their operations, not just their reporting.”
For a deeper look at how these outcomes translate into measurable revenue gains, the process of improving website conversions follows directly from what your analytics data reveals.
Key takeaways
Website analytics deliver business growth only when it is structured around specific goals, tracked consistently, and acted on through a regular review process.
| Point | Details |
|---|---|
| Define goals before tracking | Build a measurement plan that maps business objectives to specific events before launch. |
| Combine quantitative and qualitative data | Pair GA4 traffic data with Hotjar session recordings to diagnose UX problems accurately. |
| Structure tracking around the funnel | Measure entry, engagement, and conversion stages separately to find exact drop-off points. |
| Keep metrics focused | Track five core metrics consistently rather than monitoring every available data point. |
| Connect analytics to ad platforms | Link GA4 to Google Ads to optimize campaigns on actual conversion data, not just clicks. |
What I’ve learned from watching businesses misuse their own data
After working with dozens of businesses on their digital marketing since 2013, the pattern I see most often is not a lack of data. It is a lack of discipline around what the data is supposed to answer.
Most business owners log into Google Analytics, see a wall of numbers, and either feel reassured or overwhelmed. Neither response leads to action. The businesses that actually grow from analytics are the ones that start every conversation with a question: “Did more visitors complete our contact form this month than last, and if not, where did they drop off?” That question has a specific answer. “How is our website doing?” does not.
I have also seen the opposite failure: over-engineered analytics setups with 200 custom events, three attribution models running simultaneously, and no one on the team who reviews the data weekly. Complexity without process is just expensive noise.
The most effective approach I have seen for small to mid-sized businesses is a measurement plan written on a single page, a five-metric dashboard reviewed every Monday morning, and a monthly session where one specific funnel stage gets tested and improved. That cadence, applied consistently, produces more growth than any sophisticated tool configuration.
Qualitative data is the piece most businesses skip entirely. Running a Hotjar session recording review once a month takes 30 minutes and regularly surfaces problems that no quantitative report would ever reveal. A form field that confuses users, a CTA button that blends into the background, a mobile layout that breaks on certain devices. These are fixable problems that analytics data points toward, but only qualitative observation actually confirms.
— Ascendly
How Ascendlymarketing helps you turn data into growth

Ascendlymarketing has been helping small and mid-sized businesses build analytics-driven digital marketing programs since 2013. The team sets up measurement plans, configures Google Analytics 4 with accurate event taxonomy, and connects analytics insights directly to SEO, paid advertising, and conversion optimization strategies. If your website is generating traffic but not converting, or if you are spending on ads without clear attribution data, that is exactly the problem Ascendlymarketing is built to solve. Explore the full range of digital marketing services or book a consultation directly at Ascendlymarketing to start making your data work for your business.
FAQ
What is web analytics, and why does it matter for business?
Web analytics is the collection, measurement, and analysis of website data to understand user behavior and improve business outcomes. It matters because it replaces guesswork with evidence when making decisions about marketing spend, site design, and conversion strategy.
Which tools are best for website analytics?
Google Analytics 4 is the most widely used platform for tracking traffic, events, and conversions. Hotjar and Microsoft Clarity add qualitative data through heatmaps and session recordings, while Plausible and Umami offer simpler, privacy-focused alternatives for small businesses.
How do I set up website analytics correctly?
Start with a measurement plan that maps your business goals to specific trackable events before you configure any tool. In Google Analytics 4, define your conversion event taxonomy at setup so your reporting reflects actual business actions from day one.
What metrics should I track as a small business owner?
Focus on five core metrics: sessions, conversion rate, traffic by channel, bounce rate, and average session duration. Tracking fewer metrics consistently produces faster, clearer decisions than monitoring every available data point.
How does website analytics improve conversion rates?
Analytics identifies the exact funnel stages where visitors drop off, which lets you test targeted fixes rather than redesigning entire pages. Combining GA4 funnel data with Hotjar session recordings gives you both the “where” and the “why” behind conversion losses.