

TL;DR:
- Focusing on 5 to 7 revenue-aligned KPIs improves digital marketing effectiveness and decision-making. Establishing clear formulas, ownership, targets, and reporting routines ensures consistent measurement and accountability. Regular audits and a simplified dashboard approach drive better budget allocations and marketing impact.
Pick 5–7 KPIs that map directly to pipeline, revenue, and efficiency. Track those. Stop tracking the rest.
That is the short version of every effective digital marketing KPI program. The long version is what follows: a practical playbook for marketing professionals and business managers who need to define the right performance indicators, set credible targets, assign ownership, and build reporting that actually drives budget decisions.
Here is the core KPI set to start with this week:
- Pipeline created (marketing-sourced): The dollar value of opportunities your marketing activity generated
- Influenced revenue: Closed-won deals where marketing touched the account at any stage
- CAC (customer acquisition cost): Total marketing spend divided by new customers acquired in the period
- LTV-to-CAC ratio: Lifetime value divided by CAC; a ratio considered healthy for most B2B businesses
- One leading demand metric: MQL volume or demo requests, depending on your sales motion
First actions this week: assign an owner to each KPI, write down the exact formula for CAC and MQL in a shared doc, enforce UTM tagging on every campaign link, and set up two dashboards in Looker Studio or GA4: one weekly operations view for the marketing team and one monthly executive view for leadership. Research supports this two-dashboard structure as the most practical way to drive adoption across both audiences.
Ascendly Marketing uses exactly this structure with clients. The rest of this guide explains why each choice was made and how to build the complete program.
Table of Contents
- What are digital marketing KPIs, and how do they differ from metrics?
- Which frameworks help you choose the right KPIs?
- How do you run a KPI selection workshop?
- What are the right KPIs for each marketing channel?
- Which metrics are vanity metrics, and what should you track instead?
- How do you set KPI targets and find reliable benchmarks?
- How do you tie budgets to KPIs and negotiate commitments?
- What tools, dashboards, and reporting cadences should you use?
- How do you build governance and avoid metric fatigue?
- What are your next steps to implement this KPI program?
- Key Takeaways
- The KPI mistake most teams are still making
- Ascendly Marketing builds KPI programs that connect marketing to revenue
- Useful sources and further reading
What are digital marketing KPIs, and how do they differ from metrics?
A metric is any number your tools can produce. A KPI is a metric with three things attached: a target, an owner, and a decision that follows when the number moves. Pageviews are a metric. Marketing-sourced pipeline is a KPI.

That distinction sounds simple, but most teams skip it. They pull every number GA4 will export, paste it into a slide deck, and call it reporting. The result is a dashboard nobody acts on, because no one knows what “bounce rate went up 4%” means for next week’s budget.
Harvard Business School defines a marketing KPI as a quantifiable measure used to evaluate the effectiveness of marketing efforts against business objectives. The operative word is “against.” A KPI only works when it is compared to something: a target, a prior period, or a threshold that triggers a decision.
The three most common KPI traps:
- No target. A metric without a target is just a number. “We got 1,200 MQLs” means nothing without knowing whether the goal was 900 or 1,500.
- No owner. If everyone owns a KPI, no one does. Assign one person who is accountable for the number and empowered to change the inputs.
- Inconsistent formulas. The most common source of marketing-sales conflict is that marketing and sales calculate CAC or MQL differently. Standardizing KPI formulas and reviewing them quarterly reduces that friction significantly.
Pro Tip: Store your canonical KPI definitions, including exact formulas and data sources, in a single shared document (a Notion page or a Google Doc works fine). Version it. Review it quarterly. This one habit prevents more reporting arguments than any tool upgrade.
Which frameworks help you choose the right KPIs?
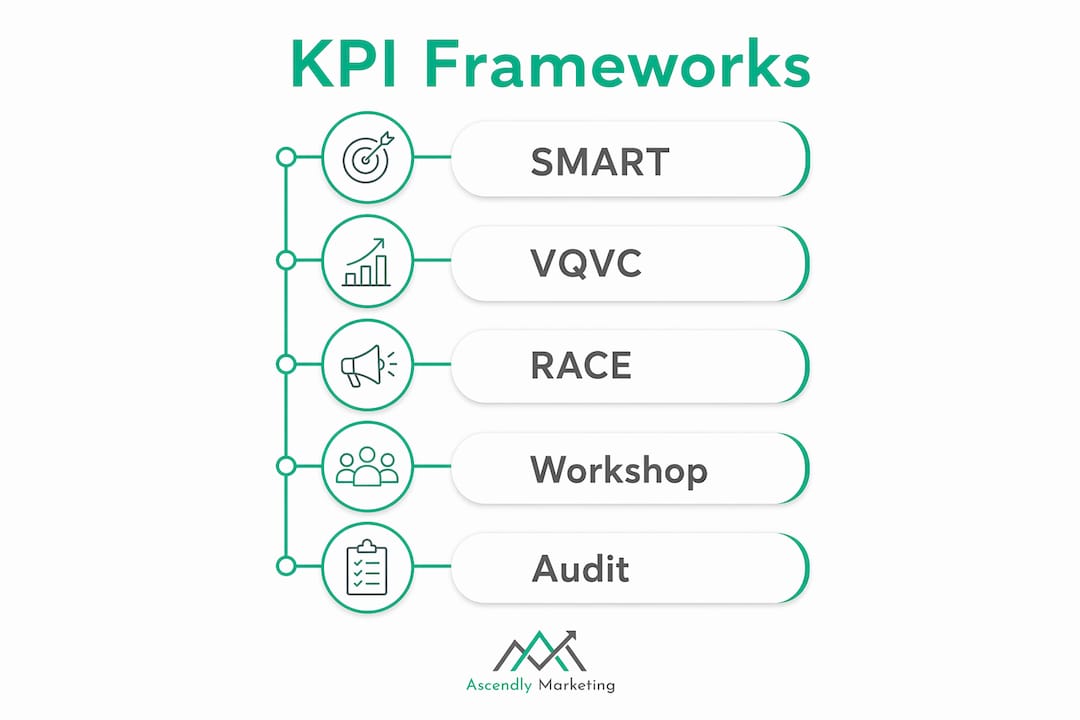
Three frameworks do most of the work: SMART, VQVC, and RACE. Used together, they cover goal alignment, marketing-specific measurement, and funnel coverage.

SMART: The baseline test for any KPI
Every KPI should pass the SMART test before it goes on a dashboard. Specific (what exactly are you measuring?), Measurable (can you pull the number from a reliable source?), Attainable (is the target realistic given historical performance?), Relevant (does it connect to a business objective?), Time-bound (what period does it cover?).
A SMART-framed KPI sounds like this: “Generate 150 marketing-qualified leads per month from paid search by the end of Q3, measured in HubSpot using the agreed MQL definition.” That is a KPI. “Increase leads” is not.
VQVC: The marketing-specific lens
VQVC (Value, Quantity, Validity, Cost) was developed specifically for digital marketing measurement. Quantity asks how many (visits, leads, responses). Quality asks how good (conversion rate, engagement rate). Value asks what it is worth (revenue per visitor, pipeline per campaign). Cost asks what you paid (CPL, CAC, ROAS). Running a candidate KPI through VQVC quickly reveals whether you are measuring the right dimension or just the easiest one.
RACE: Mapping KPIs across the funnel
The RACE framework (Reach, Act, Convert, Engage) maps neatly to funnel stages and helps teams avoid over-indexing on one part of the funnel. Reach covers awareness and traffic. Act covers engagement and lead capture. Convert covers pipeline and closed revenue. Engage covers retention and LTV.
| Business objective | Primary KPI | Supporting metrics |
|---|---|---|
| Awareness | Branded search volume, organic reach | Impressions, share of voice |
| Demand generation | MQL volume, demo requests | CPL, form conversion rate |
| Pipeline creation | Marketing-sourced pipeline ($) | SQL volume, pipeline velocity |
| Retention / expansion | LTV-to-CAC ratio, net revenue retention | Repeat purchase rate, churn rate |
North-Star KPI by business model:
- Product-led growth: Activation rate or free-to-paid conversion rate
- Sales-led (enterprise): Marketing-sourced pipeline and pipeline velocity
- ABM (account-based marketing): Target-account engagement score and influenced pipeline within named accounts
Pro Tip: Pick one North-Star KPI per quarter that the whole team can rally around. It does not replace the full KPI set, but it gives everyone a single number to optimize toward when priorities conflict.
How do you run a KPI selection workshop?
A brief workshop with the right people in the room can cut a bloated metric list down to a focused, decision-ready KPI set. Here is how to run it.
Pre-work (before the session):
- Pull a list of every metric currently in your reports (GA4, Google Ads, Meta Ads Manager, HubSpot, Salesforce)
- Note the data source and current owner for each metric
- Identify which metrics have targets and which do not
- Flag any metrics that have never changed a decision
Workshop steps:
- Map business goals to funnel stages. Write the top 3 company goals for the quarter on a whiteboard. For each goal, identify which funnel stage marketing owns.
- Generate candidate KPIs. For each funnel stage, list 3–5 candidate KPIs. Do not filter yet.
- Apply the decision rule. For each candidate, ask: “If this number moved 20% in either direction, would we change a budget allocation, a channel mix, or a qualification threshold?” If the answer is no, cut it.
- Cap the list at 5–7 core KPIs. Executive reporting works best when it focuses on a small set of revenue-aligned KPIs. More than 7 dilutes attention.
- Assign one owner per KPI. Not a team. One person.
- Set next-quarter targets. Use historical baselines (see Section 7) and agree on stretch vs. committed targets.
Deliverables from the session:
- Canonical definitions doc with exact formulas and data sources
- Owner list with one name per KPI
- Dashboard spec: which KPIs go on the weekly ops view, which on the monthly exec view
- Next-quarter targets with agreed review dates
Pro Tip: Run this workshop at the start of each quarter, not just once. KPIs that made sense in Q1 may be irrelevant by Q3 if the business model or go-to-market motion has shifted.
What are the right KPIs for each marketing channel?
Channel-specific KPIs keep teams accountable for what they can actually control. Here is the full breakdown, including an e-commerce example that ties channel metrics back to revenue.
Paid search and social (Google Ads, Meta Ads Manager)
The primary KPIs for paid channels are cost per conversion, ROAS (return on ad spend), and marketing-sourced pipeline. Supporting metrics include impression share, CTR, and conversion rate by campaign. ROAS tells you efficiency; pipeline tells you whether that efficiency translates to revenue. Both matter. Paid channel management requires tracking both dimensions to avoid optimizing for cheap clicks that never close.
SEO and content (GA4, Looker Studio)
For organic, the KPIs that matter are organic sessions from your ICP (ideal customer profile), target-keyword CTR in Google Search Console, and search-to-MQL rate. Assisted conversions in GA4 capture organic’s role in multi-touch journeys that paid channels often claim credit for. B2B SEO measurement requires tracking keyword rankings alongside conversion contribution, not just traffic volume.
Email KPIs split into deliverability health (inbox placement rate, list churn) and engagement performance (open rate, click-to-convert rate, revenue per recipient). When email is a nurture engine, the most important KPI is MQL-to-SQL lift: how much faster do nurtured leads convert compared to cold ones?
Social media
Reach and engagement rate are table stakes. The KPI that actually matters for most B2B teams is campaign-sourced pipeline: how many opportunities can be traced back to a social touchpoint? Audience quality signals (follower-to-lead conversion rate, engagement from ICP job titles) are useful supporting metrics.
CRO (conversion rate optimization)
CRO KPIs center on experiment delta (the percentage lift from a winning test), conversion rate by cohort, and revenue per visitor. Funnel drop-off points are supporting diagnostics, not KPIs themselves, but they tell you where to run the next experiment.
E-commerce example
An e-commerce team tracking the full revenue picture would use: product-level AOV (average order value), add-to-cart rate, checkout abandonment rate, and repeat-purchase rate. These feed directly into CAC and LTV calculations. If AOV drops 10% while CAC holds steady, LTV-to-CAC deteriorates even though the acquisition machine looks fine.
| Channel | Primary KPI | Supporting metrics | Owner |
|---|---|---|---|
| Paid search (Google Ads) | Cost per conversion, ROAS | Impression share, CTR, conversion rate | Paid media manager |
| Paid social (Meta Ads Manager) | Marketing-sourced pipeline, CPL | Reach, engagement rate, link CVR | Paid media manager |
| SEO / content (GA4) | Organic sessions (ICP), search-to-MQL rate | Keyword CTR, assisted conversions | SEO lead |
| Click-to-convert rate, revenue per recipient | Open rate, deliverability, list churn | Email / CRM manager | |
| Social media | Campaign-sourced pipeline | Engagement rate, audience quality signals | Social media manager |
| CRO | Experiment delta (lift %), revenue per visitor | Funnel drop-off points, conversion rate by cohort | Growth / CRO lead |
| E-commerce | AOV, repeat-purchase rate | Add-to-cart rate, checkout abandonment | E-commerce manager |
Pro Tip: For B2B teams with long sales cycles, add a “channel-to-pipeline” column to your paid and organic reports. It forces the conversation away from CPL and toward the metric that finance actually cares about.
Which metrics are vanity metrics, and what should you track instead?
Vanity metrics are numbers that look good in a slide deck but do not change a decision. The most common offenders: total pageviews, raw follower count, total impressions, and email open rate in isolation. None of these tell you whether marketing is generating revenue.
Common vanity metrics and their actionable replacements:
- Total pageviews → organic sessions from ICP pages. Pageviews include bot traffic, direct navigation, and internal visits. Filtering to ICP-relevant pages in GA4 gives you a number worth optimizing.
- Raw follower count → engaged audience size. A follower who never clicks is worth nothing. Track the subset that engages with content and follows a link.
- Total impressions → impression share on target keywords. Impressions without context are noise. Impression share on your top 10 revenue-driving keywords is a real signal.
- Email open rate alone → click-to-convert rate. Open rates were already unreliable before Apple’s Mail Privacy Protection made them nearly meaningless for trend analysis. Click-to-convert rate measures intent.
- Social likes → campaign-sourced pipeline. Likes are free. Pipeline is not.
A metric graduates to KPI status when two things are true: you have a target for it, and a 20% swing in either direction would change a decision. Until then, it lives in a supporting metrics layer, not on the executive dashboard.
Pro Tip: Use internal historical baselines as your primary benchmark, not external industry averages. Internal cohort data produces more reliable targets than external averages because it accounts for your specific audience, sales cycle, and product. External benchmarks are useful for a sanity check, not a target.
How do you set KPI targets and find reliable benchmarks?
Target-setting is where most KPI programs fall apart. Teams either copy industry benchmarks without adjusting for their own baseline or set aspirational numbers that have no connection to historical performance.
Baseline calculation
Start with your historical median for the metric over the last 4–6 quarters, then apply a seasonal adjustment if your business has clear seasonality. The median is more reliable than the mean for noisy marketing data because it is less sensitive to outlier months. Once you have a baseline, set two targets: a committed target (the number you are confident hitting given current resources) and a stretch target (what you could hit with optimal execution).
Example calculation: Working backward from revenue
This is the most useful target-setting exercise a marketing team can run. Start with the revenue goal and work backward:
- Revenue goal: $2M in new ARR
- Average deal size: $40,000
- Deals needed: 50
- SQL-to-close rate: 40%, so SQLs needed: 125
- MQL-to-SQL rate: 30%, so MQLs needed: 417
- Channel conversion rates determine how to split that MQL target across paid, organic, and email
This revenue-to-pipeline conversion approach turns a finance target into a concrete upstream KPI that marketing can own and plan against.
| Benchmark source | What it provides | How to use it |
|---|---|---|
| Internal historical data (CRM, GA4) | Seasonally adjusted baseline by channel | Primary target-setting input |
| Industry reports (e.g., Insigra Reports) | Median CPL, conversion rates by vertical | Sanity check; flag if you are 2x above or below |
| Platform benchmarks (Google Ads, Meta) | Average CTR, CPC by industry | Useful for new channels with no internal history |
| Cohort tracking (CRM pipeline reports) | Lead-to-close rates by source and quarter | Most reliable for long sales cycles |
Pro Tip: When presenting targets to leadership, always show three numbers: the committed target, the stretch target, and the leading indicator you will watch weekly to know if you are on track. This reframes the conversation from “did you hit it?” to “what are you seeing in the leading data?”
How do you tie budgets to KPIs and negotiate commitments?
Budget allocation and KPI targets are the same conversation. If you set a target of 417 MQLs and your CPL is $120, you need roughly $50,000 in media spend to hit it, plus content and tooling costs. The math is straightforward. The negotiation is not.
Allocation logic by channel:
- Start with your CPL and conversion rate for each channel
- Multiply CPL by the MQL volume each channel needs to contribute
- Add a 15–20% buffer for underperforming campaigns that will need to be paused and reallocated
- Separate brand spend (which protects existing demand) from demand-generation spend (which creates new pipeline)
Negotiation checklist for KPI commitment meetings:
- Bring historical performance data, not projections alone
- Show the revenue math: how your MQL target connects to the pipeline goal
- Name the leading indicators you will report weekly (MQL volume, CPL trend)
- Define the escalation threshold: “If CPL rises above $X for two consecutive weeks, we will reallocate budget from that channel”
- Ask for a 30-day review clause so targets can be adjusted if market conditions change materially
Pro Tip: When a campaign misses a leading indicator two weeks in a row, do not wait for the monthly review. Move budget immediately. The cost of waiting is compounding: a bad week becomes a bad month, and a bad month becomes a missed quarter.
Practical reallocation example: A paid social campaign targeting mid-funnel prospects shows CPL rising 35% over three weeks while MQL quality (measured by SQL conversion rate) drops. The decision is clear: pause that ad set, shift the budget to the paid search campaigns where CPL is holding steady, and document the reallocation in the campaign log so the attribution model reflects the change.
What tools, dashboards, and reporting cadences should you use?
Measurement reliability depends on three things: the right tools in the right roles, a consistent attribution model, and a reporting cadence matched to your sales cycle.
Recommended tool roles
- GA4: Web behavior, traffic source analysis, goal completions, assisted conversions, and audience segmentation. The foundation for organic and content KPIs.
- Google Ads: Paid search impression share, CTR, conversion rate, cost per conversion, and ROAS. The primary source for paid search KPIs.
- Meta Ads Manager: Paid social reach, CPM, link click rate, and campaign-sourced conversions. Use the Meta pixel alongside GA4 for cross-channel attribution.
- HubSpot: Lead lifecycle tracking, MQL-to-SQL conversion, email performance, and contact-level attribution. The source of truth for demand and pipeline KPIs in most SMB and mid-market stacks.
- Salesforce: Pipeline value, pipeline velocity, deal stage conversion rates, and closed-won revenue. The source of truth for revenue KPIs in enterprise and sales-led organizations.
- Looker Studio: Unified dashboards that pull from GA4, Google Ads, HubSpot, and Salesforce via connectors. The best free option for building the two-dashboard structure described in this guide.
Attribution: Pick one model and keep it
First-touch, last-touch, linear multi-touch, and revenue-based attribution each tell a different story. None is perfect. Consistency beats perfection: switching attribution models mid-year breaks trend comparability and makes it impossible to know whether a KPI moved because of a real change or a measurement change. Pick one model, document it, and only revisit it during a quarterly KPI audit.
For most B2B teams, a linear multi-touch model is the most defensible starting point. It distributes credit across all touchpoints and avoids the political problem of first-touch (which credits awareness channels) or last-touch (which credits sales-adjacent channels).
Dashboard templates
Weekly operations dashboard (for the marketing team):
- MQL volume vs. target (week-over-week)
- CPL by channel
- Paid CTR and conversion rate
- Organic sessions from ICP pages
- Email click-to-convert rate
Monthly leadership dashboard (for executives):
- Marketing-sourced pipeline ($) vs. target
- Influenced revenue
- CAC vs. prior quarter
- LTV-to-CAC ratio
- MQL-to-SQL conversion rate
For quarterly efficiency reviews, add ROAS by channel, CAC payback period, and a cohort analysis showing lead-to-close rates by source. Marketing analytics for SMBs follows the same layered structure.
Reporting cadence
| KPI group | Review cadence | Why |
|---|---|---|
| Demand metrics (MQL, CPL, CTR) | Weekly | Fast feedback loop; actionable within days |
| Pipeline and revenue metrics | Monthly | Aligns with sales cycle; avoids noisy weekly swings |
| Efficiency metrics (CAC, ROAS, LTV-to-CAC) | Quarterly | Requires enough data volume to be statistically meaningful |
| Cohort analysis (lead-to-close by source) | Quarterly | Long sales cycles need cohort tracking, not point-in-time snapshots |
Pro Tip: Set up UTM governance before you build any dashboard. Every campaign link needs a consistent UTM structure (source, medium, campaign, content) enforced via a shared UTM builder spreadsheet. Without it, GA4 and your CRM will disagree on where leads came from, and no attribution model will save you.
How do you build governance and avoid metric fatigue?
The most common reason KPI programs fail is not bad data. It is too many metrics reviewed too often by people who cannot act on them. Governance is the system that prevents that.
Cadence and governance checklist
- Assign one owner per KPI, documented in the canonical definitions doc
- Store all KPI definitions, formulas, and data sources in a single versioned document
- Choose one attribution model and document it alongside the KPI definitions
- Enforce UTM and CRM campaign tagging rules before any campaign goes live
- Run a quarterly KPI audit: review each KPI against the decision rule (would a 20% swing change a decision?), cut any that fail, and add new ones only if a business objective requires them
- Publish a one-page leadership scorecard monthly: 5–7 KPIs, actual vs. target, and a one-line status note per KPI
Run a quarterly KPI audit
The audit takes about 60 minutes. Pull the full metric list. For each metric, ask: does it have a target? An owner? Has it changed a decision in the last 90 days? If the answer to any of those is no, it is a candidate for removal or demotion to a supporting metric. Top-performing B2B teams track 8–12 KPIs spanning lead quality, pipeline velocity, and revenue efficiency. If your list is longer than that, the audit is overdue.
| Governance element | Recommended action | Frequency |
|---|---|---|
| KPI definitions doc | Review and version | Quarterly |
| Owner assignments | Confirm or reassign | Quarterly |
| Attribution model | Document; change only at quarter start | Annually or less |
| UTM / CRM tagging rules | Audit for compliance | Monthly |
| Leadership scorecard | Publish | Monthly |
| Full KPI audit | Cut non-decision metrics | Quarterly |
Top-performing B2B teams track 5–7 KPIs, not more.
Pro Tip: Use cohort-based tracking for any program with a sales cycle longer than 60 days. Following a lead cohort (all MQLs from a given month) through the funnel gives you an honest read on program performance. Point-in-time snapshots mix cohorts and make conversion rates look better or worse than they actually are.
What are your next steps to implement this KPI program?
The framework is only useful if it gets implemented. Here is a 30/60/90-day checklist to turn this guide into a working program.
Days 1–30:
- Pick 5–7 KPIs from the core set (pipeline created, influenced revenue, CAC, LTV-to-CAC, one leading demand metric)
- Write the canonical definitions doc with exact formulas and data sources
- Assign one owner per KPI
- Enforce UTM tagging on all active campaigns
- Set up the weekly operations dashboard in Looker Studio or GA4
Days 31–60:
- Run the KPI selection workshop with marketing, sales, and finance stakeholders
- Build the monthly leadership dashboard
- Set committed and stretch targets for the quarter using the revenue-backward calculation
- Document the attribution model and CRM campaign rules
Days 61–90:
- Publish the first monthly leadership scorecard
- Run the first 60-minute KPI audit
- Present the KPI program to leadership with the leading indicator framework
- Schedule quarterly audit dates for the rest of the year
Keep the KPI set lean. The goal is not comprehensive measurement. It is a small set of numbers that force good decisions. Test, iterate, and cut anything that does not earn its place on the dashboard.
Key Takeaways
Effective digital marketing KPI programs require a small set of revenue-aligned metrics, standardized formulas, clear ownership, and a reporting cadence matched to your sales cycle.
| Point | Details |
|---|---|
| Limit to 5–7 KPIs | Limit executive KPIs to a small set that map directly to pipeline, revenue, and efficiency objectives. |
| Standardize formulas and owners | Document exact formulas for CAC and MQL in a versioned definitions doc; assign one owner per KPI. |
| Use a two-dashboard structure | Build one weekly operations dashboard for the team and one monthly leadership dashboard for executives. |
| Match cadence to sales cycle | Review demand metrics weekly, pipeline monthly, and efficiency metrics (CAC, ROAS, LTV-to-CAC) quarterly. |
| Ascendly Marketing’s approach | Ascendly Marketing runs KPI workshops, builds both dashboards, and governs the program quarterly for clients. |
The KPI mistake most teams are still making
Most marketing teams track too many metrics because they confuse activity with accountability. A 40-row dashboard does not make a team more data-driven. It makes them more confused, because no one knows which number to act on when three of them are moving in different directions.
The real discipline in KPI setting is subtraction. Every metric you add to a dashboard is a claim on someone’s attention. Most of those claims are not worth making. The metrics that matter are the ones where a 20% swing forces a concrete decision: move budget, change a qualification threshold, pause a campaign, or escalate to leadership. Everything else is noise dressed up as data.
There is also a subtler problem that most guides skip: the difference between a KPI that measures what you did and a KPI that predicts what will happen. MQL volume is a lagging indicator of campaign performance but a leading indicator of pipeline. CAC is a lagging indicator of efficiency. If your dashboard is all lagging metrics, you are always reacting. Pairing each lagging KPI with one leading indicator (CPL trend, engagement rate from ICP accounts, organic CTR on target keywords) gives you enough warning to course-correct before a bad month becomes a missed quarter.
The teams that get this right are not the ones with the most sophisticated attribution models. They are the ones that agreed on five numbers, documented the formulas, and reviewed them on a consistent schedule. That is the whole program.
Ascendly Marketing builds KPI programs that connect marketing to revenue
Setting up a KPI program from scratch takes time most marketing teams do not have. Ascendly Marketing runs the full process: a structured KPI workshop to identify the right 5–7 metrics for your business model, dashboard implementation in Looker Studio or your existing BI stack, UTM and CRM governance setup, and a quarterly audit cadence to keep the program clean. The result is a reporting structure that finance and sales will actually trust, because the numbers connect directly to pipeline and revenue.

Clients typically see the biggest impact in the first 90 days, when the shift from a bloated metric list to a focused KPI set makes budget reallocation decisions faster and clearer. Whether you need full-service digital marketing support or a focused KPI and analytics engagement, Ascendly Marketing works with the tools you already have.
To get started, contact Ascendly Marketing with a brief description of your current reporting setup, your primary revenue goal for the next quarter, and the channels you are currently running. That is enough to scope a KPI workshop and a first dashboard build.
Useful sources and further reading
The sources and tools below are the most useful references for formulas, benchmarks, and implementation guidance.
Reference sources:
- B2B Marketing KPIs: Choose, Track and Use the Right Metrics (Leadfeeder): practical KPI selection framework, attribution guidance, and a 10-step audit checklist
- 12 Marketing KPIs Every B2B Team Should Track (Insigra Reports): a funnel-stage KPI list with cadence recommendations and benchmark cautions
- How to Show Leadership Exactly How Marketing Supports Company Goals (B2B Planr): the revenue-backward target-setting method and executive reporting guidance
- B2B Marketing KPI: What It Is, How to Measure It, and Why It Matters (Sona): formula standardization and cross-functional trust guidance
- 7 Marketing KPIs You Should Know and How to Measure Them (Harvard Business School Online): foundational definitions and measurement principles
Tools referenced in this guide:
| Tool | Role in a KPI program |
|---|---|
| Google Analytics 4 (GA4) | Web behavior, traffic source analysis, assisted conversions, goal completions |
| Google Ads | Paid search KPIs: impression share, CTR, conversion rate, cost per conversion, ROAS |
| Meta Ads Manager | Paid social KPIs: reach, CPM, link CTR, campaign-sourced conversions |
| HubSpot | Lead lifecycle, MQL-to-SQL tracking, email performance, contact-level attribution |
| Salesforce | Pipeline value, pipeline velocity, deal stage conversion, closed-won revenue |
| Looker Studio | Unified dashboards connecting GA4, Google Ads, HubSpot, and Salesforce |