

A marketing team can have three dashboards open and still not know whether the website is helping the business. One screen shows sessions, another shows bounce rate, and a third shows channel splits, but the leadership question stays unanswered. Did that traffic turn into calls, booked meetings, purchases, or qualified leads?
That gap is where a website analytics agency earns its keep. The work is not just building reports, because reports alone do not tell a team whether the numbers can be trusted or whether the tracked events match real business outcomes. Measurement quality is uneven across the web, and W3Techs data cited in 2026 says 43.8% of websites use none of the traffic analysis tools it monitors, while Google Analytics is used by 45.3% of all websites and holds 80.6% of the traffic-analysis-tool market share among the tools it tracks (website analytics statistics for 2026). That means plenty of companies are either uninstrumented or only partly instrumented, which creates cleanup work before optimization can start.
The Dashboard Trap Most Teams Fall Into
A familiar scene plays out inside a small or mid-sized business. Someone in marketing exports a weekly report, someone else checks ad platform numbers, and a founder asks the one question nobody can answer cleanly. The website looks busy, but busy is not the same as productive.
Data is not the same as trustworthy data
Teams often confuse access to data with confidence in data. A dashboard can show traffic from organic search, paid media, and email, but if form submits break after a redesign or a consent banner change, the chart is only telling part of the story. W3Techs emphasizes that analytics quality depends on verifying the plumbing after launches, redesigns, form changes, plugin updates, and tracking migrations, and it also recommends comparing GA4 conversions against CRM records and actual sales outcomes (website analytics statistics for 2026).
That distinction matters because web analytics has moved far beyond visitor counting. Businesses now want calls, form submissions, bookings, revenue, and close rate, not just pageviews. The practical problem is simple. If the underlying tracking is wrong, the most polished dashboard in the world will still point people toward the wrong fix.
Practical rule: If a metric cannot be traced back to a real business action, treat it as a working draft, not a decision-making input.
Why this article focuses on operations, not just tools
A lot of analytics conversations stop at software names. That leaves buyers with a stack of dashboards and no clear process for making the data useful. The better question is operational. Who defines what counts as a conversion, who checks whether the event fired correctly, and who confirms that the reported numbers line up with CRM records?
That is the core job of a website analytics agency. The agency is there to close the gap between raw tracking and business insight, then keep that system dependable after site changes, campaign changes, and platform migrations. Once you look at analytics through that lens, tool selection becomes a smaller question than measurement design, validation, and reporting discipline.
What a Website Analytics Agency Actually Does
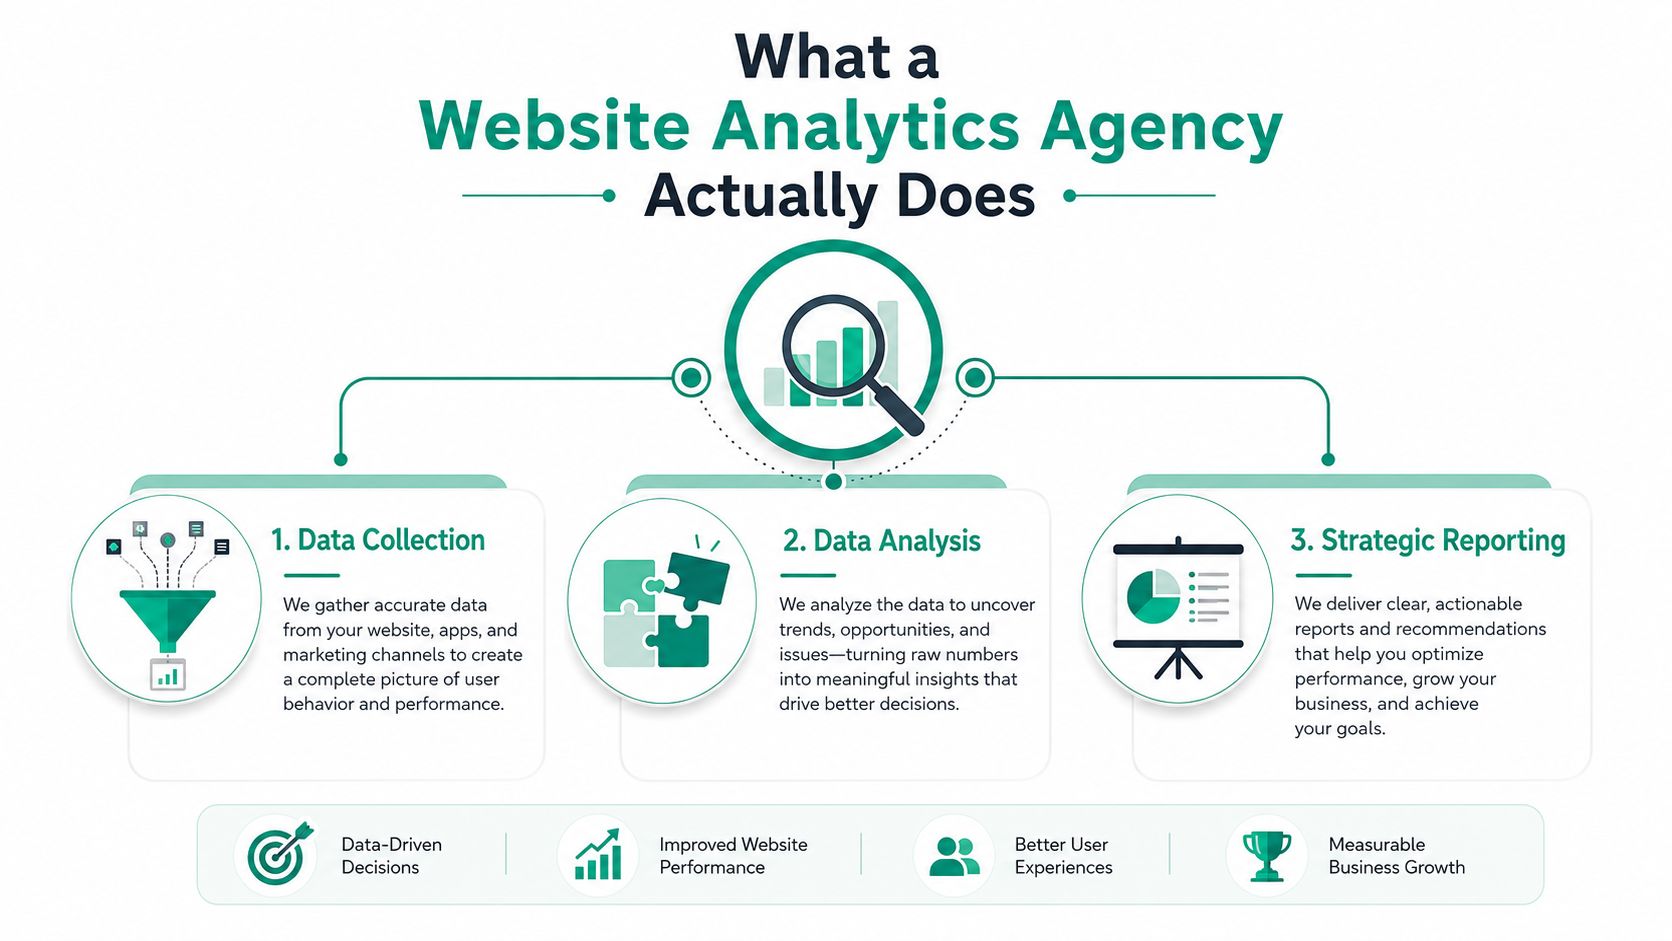
A website analytics agency is hired to make site data usable for business decisions. The work is not just collecting numbers. It starts with deciding what should count as a meaningful action, then checking that those actions are tracked correctly, and finally turning the results into reporting that a team can act on. A general definition of analytics focuses on collecting, analyzing, and reporting data so an organization can understand and improve performance, and that framework fits this work well.
From visitor counting to business measurement
The older model of analytics focused on traffic volume. That still matters, but buyers now care more about the outcomes behind the visits. HubSpot’s 2026 marketing statistics list the metrics marketers care about most as lead quality and MQLs at 39%, lead-to-customer conversion rate at 34%, ROI at 31%, customer acquisition cost at 30%, and lead generation volume at 29% (HubSpot marketing statistics). That shift changes the agency’s role from reporting activity to showing how the site supports revenue efficiency.
A concrete e-commerce example makes this easier to see. A shopper lands on a product page, clicks add to cart, starts checkout, and drops off at shipping. If the setup only tracks sessions, the team knows a visit happened. If the agency has built the right event tracking, the team can see where the checkout broke down and whether the issue came from page speed, shipping friction, or a payment-step error.
The difference between dashboards and accountability
A dashboard is a display. Accountability is a process. Agencies that focus only on presentation may produce attractive charts, but they leave out the work that makes the data dependable. Agencies that focus on performance accountability define events, set conversion rules, align attribution, and check CRM data so the reporting stack reflects the customer journey instead of a loose collection of metrics.
The technical pieces matter because business analytics now covers more than top-of-funnel traffic. It spans product views, add-to-cart actions, checkout steps, purchases, lead forms, booked appointments, and qualified leads. That is why a serious agency spends time on measurement design before it spends time on report layouts.
The workflow is visible in this example of how a website analytics agency handles data collection, analysis, and strategic reporting.
A strong agency does not sell the tool first. It builds the measurement system, checks that it holds up in real use, and then shapes the reporting so the numbers can be trusted.
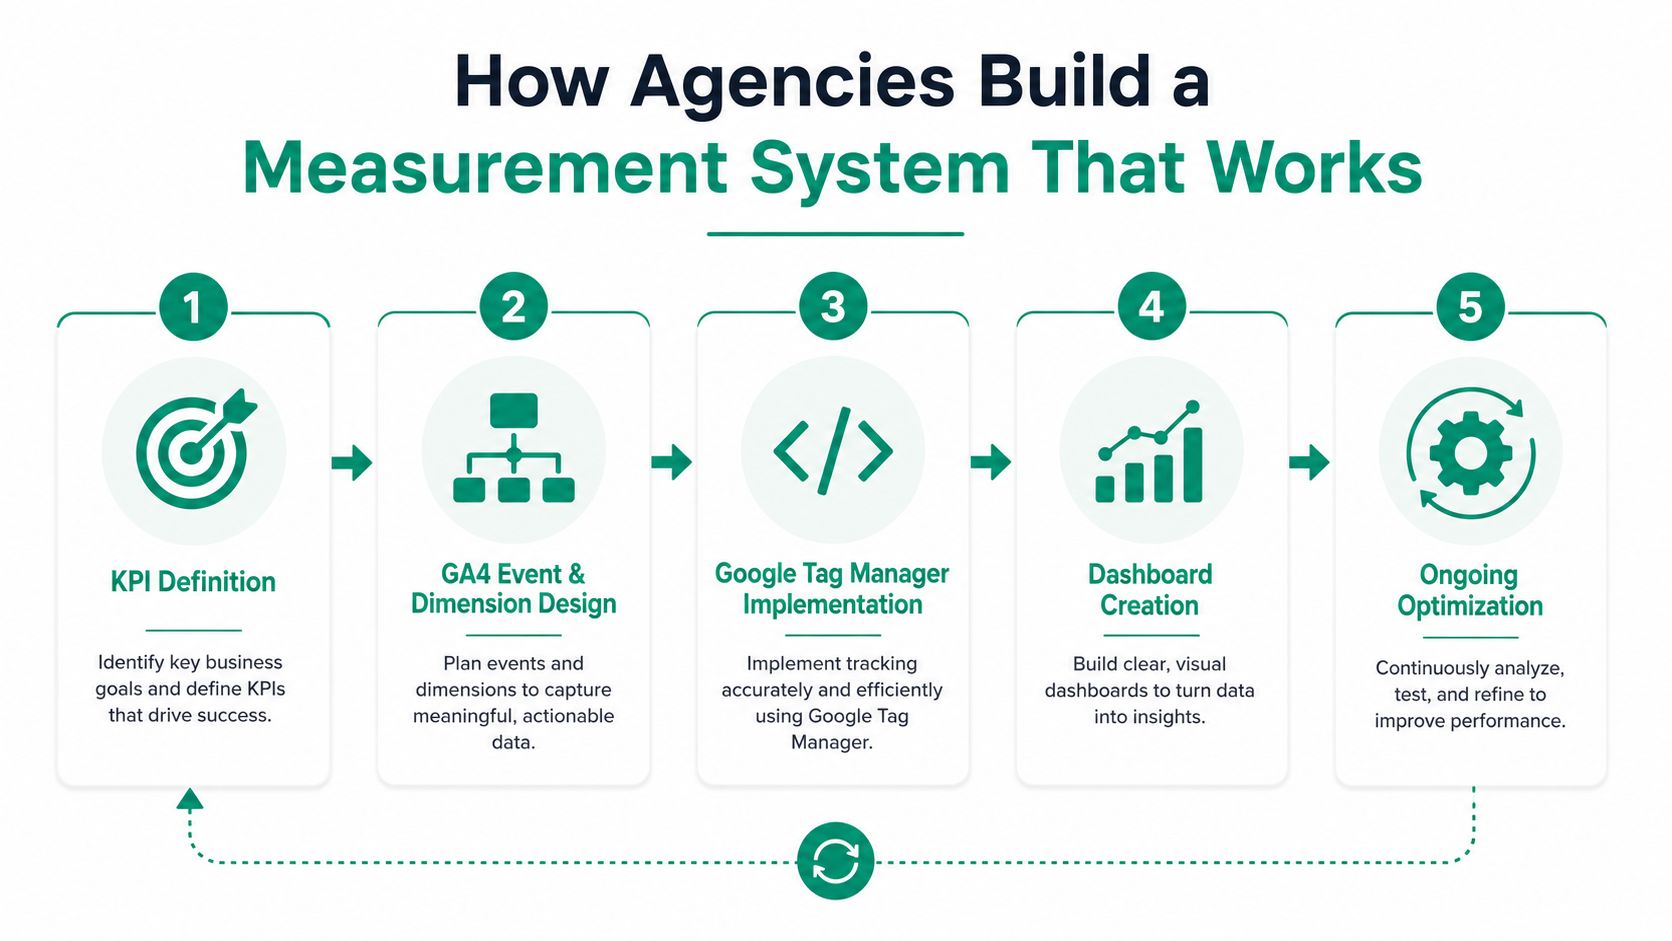
How Agencies Build a Measurement System That Works
A working measurement system starts with business goals, not tags. The reason is straightforward. If the team never agrees on what success means, tracking will fill up with events that look active but do not answer the business question.
The setup sequence that keeps tracking usable
Most agency implementations follow a clear sequence. First comes KPI definition. Then the team maps events and custom dimensions in GA4, usually through Google Tag Manager. After that, the agency validates tracking across browsers and devices, because a form submit that works in Chrome but fails on Safari is not a real measurement system.
Think of tracking like electrical wiring. If one line is loose behind the wall, the lights may still turn on in the living room, but the kitchen will go dark when someone flips a switch there. Analytics works the same way. A CTA click, a form submit, or a booking event can look fine in one place and disappear in another if the implementation is inconsistent.
Why validation and reconciliation come last
The final step is reconciliation. That means comparing GA4 conversions with CRM records and actual sales outcomes so the agency can check whether the numbers line up with the business system. The reason this matters is attribution gaps. If micro-conversions like form submits and CTA clicks are missing, optimization work becomes reactive, and the team ends up adjusting headlines or ad spend based on surface-level traffic patterns instead of the actions that generate revenue.
A stronger workflow uses validation as a habit, not a one-time check. The agency confirms that the event taxonomy makes sense, that the tags fire when expected, and that reports stay aligned after site updates. This keeps the measurement system useful when the website changes, which is when weak setups usually break.
For a deeper view of measurement planning in a small-business setting, the marketing analytics guide for SMB growth in 2026 shows how the same logic applies when resources are tight, and every tracked event has to earn its place.
Unified Dashboards and Multi-Channel Journey Analysis
A team can’t make a channel decision in isolation if the customer journey moves across several touchpoints. That’s why agencies connect Google Analytics, Google Search Console, rank trackers, backlink databases, CRM systems, and ad platforms into one reporting layer. The point is not to show more charts. The point is to compare channels against the same KPI framework.
Why a single reporting layer changes the question
When data sits in separate tools, each channel defends its own success. Search reports celebrate traffic. Paid reports celebrate clicks. CRM reports celebrate closed deals. Once the agency unifies those sources, the business can ask a better question: which channel helped produce the outcome we care about?
Multi-channel journey analysis is where that answer shows up. A buyer might first discover a brand through organic search, return later through branded search, then convert after seeing a retargeting ad or an email. Without unified reporting, each channel gets partial credit or no credit at all. With unified reporting, the team sees the path and can make a calmer budget decision.
A simple e-commerce path that isolated dashboards miss
Take a shopper who finds a blog post through Google, leaves, comes back two days later through branded search, and buys after a retargeting ad. The blog post did the first job. The ad did the last job. The branded search showed recall and intent. Only a connected reporting layer can show the sequence clearly enough for content and media teams to act on it.
That is why agencies use this setup to identify funnel drop-offs and compare channels in one place. It also changes content strategy. If organic search introduces new users but retargeting closes most of the sales, the team can stop asking which channel “won” and start asking how each channel supports the journey.
The cohort analysis guide fits neatly here if you want to see how grouped behavior helps separate first-time traffic from returning buyers without flattening the story into one metric.
The KPIs an Agency Reports On and Why They Matter
Leadership usually wants a short list, not a forest of metrics. A good agency starts with the business outcome, then traces the path backward to the signals that shape it. That order keeps the report tied to decisions, not just to activity.
The first layer is the set of metrics that show whether the website is producing work worth sales time. Those often include qualified leads, lead-to-customer conversion rate, ROI, customer acquisition cost, and lead generation volume. The point is simple: if the site is sending the wrong people to sales, traffic growth can look healthy while the pipeline stays weak.
| Tier | Metric | Why It Matters | Source |
|---|---|---|---|
| Outcome | Qualified leads | Shows whether the site is attracting people worth sales time | HubSpot marketing statistics |
| Outcome | Lead-to-customer conversion rate | Connects website activity to closed business | HubSpot marketing statistics |
| Outcome | ROI | Helps leadership judge whether the effort is paying off | HubSpot marketing statistics |
| Outcome | Customer acquisition cost | Shows the cost side of growth | HubSpot marketing statistics |
| Supporting | Lead generation volume | Gives context for pipeline creation | HubSpot marketing statistics |
| Supporting | Sessions | Useful for trend context, not a finish line | HubSpot web traffic analytics |
| Supporting | Page views | Helps spot content interest and navigation patterns | HubSpot web traffic analytics |
| Supporting | Bounce rate | Can help diagnose friction, but rarely explains revenue on its own | Digital.gov analytics guidance |
The report should move from revenue back to the event
A useful monthly report starts with the top-line outcome, then walks backward. Which campaign generated the lead? Which page or offer converted the lead? Which event fired at the right moment? Which source brought the person in?
That sequence matters because it keeps the conversation focused on causes, not clutter. Our Vanta review for startups shows how buyers often need structured, decision-ready information rather than a pile of screenshots. Analytics reporting should follow the same pattern: clear enough for leadership to read and specific enough for the analyst to act on.
Better analytics is usually about fewer validated metrics. More dashboards rarely fix a bad measurement model.
When In-House Analytics Makes Sense and When to Hire an Agency
A small team does not always need outside help. If one person owns the site, the CRM, and the reports, the in-house model can work well enough for basic visibility. The question is whether the business has the process maturity to benefit from external support.
Readiness tells you more than size does
Current guidance says buyers should document the tech stack, access credentials, historical data, stakeholder visibility needs, and business objectives before hiring an agency (analytics agency selection guidance). That checklist matters because the main bottleneck is often organization, not software. If nobody knows which systems hold the truth, an agency will spend the first stretch untangling access and definitions.
Clear signals that outside help is worth it include unclear results, many stakeholders, and internal talent or resource gaps. Those are the situations where reporting becomes political, not just technical. An agency can reduce friction by setting measurement frameworks that align with OKRs and the customer lifecycle, then translating the numbers into a format leadership can use.
A simple comparison helps buyers decide
| Situation | In-house usually fits | Agency support usually fits |
|---|---|---|
| Scope | One site, one buyer, simple funnel | Several stakeholders and multiple channels |
| Team capacity | Someone can maintain tracking and reporting consistently | No one has time to validate and reconcile data |
| Data setup | Clean stack, stable site, few integrations | Fragmented tools, CRM gaps, changing site structure |
| Decision needs | Basic visibility and routine reporting | Cross-channel analysis and stakeholder-ready reporting |
A small owner-operator with a straightforward site can manage analytics in-house if the measurement needs stay modest. A growth-stage team with sales, marketing, and operations all asking different questions usually benefits from outside structure.
How to Vet and Onboard an Analytics Agency
A buyer can spot a weak fit early by asking how the agency thinks about measurement, not just dashboards. The best conversations sound specific. They mention OKRs, CRM alignment, validation practices, and how reporting will reconcile with sales data.
Questions that reveal whether the agency can do the work
Start with the measurement framework. Ask how the agency defines conversions, how it handles event taxonomy, and how it checks whether a tracked action maps to a real business outcome. Then move to integrations. If the agency cannot explain how reporting connects to the CRM, the numbers will stay trapped in separate systems.
Red flags are easy to notice once you know where to look. Vague deliverables, no audit of existing tracking, and reports that never reconcile against CRM or sales data all point to a service that is heavier on output than accuracy. The buyer guide on how to choose a digital marketing agency is useful here because the same logic applies: ask for process, not just promises.
What onboarding should look like
A sane onboarding process starts with a measurement audit. The agency reviews the current setup, checks tracking against the site structure, and notes where data loss may be happening. Then it reviews the event taxonomy, provisions access, and decides whether any historical backfill is needed.
After that, the agency sets a reporting cadence, often around a 30-60-90 day rhythm. Early reports should focus on validation and consistency, not on dramatic conclusions. That approach gives the buyer a clean baseline before anyone starts changing campaigns or site elements.
Ask for the first audit before you ask for the first dashboard.
If the agency can explain the sequence from audit to validation to stakeholder reporting without drifting into jargon, that’s a good sign. If the answer stays abstract, the team probably doesn’t have a reliable system yet.
Where Ascendly Marketing Fits in This Picture
Ascendly Marketing’s approach lines up with the workflow described above. The team’s discover, plan, execute, report process matches the path from KPI definition to implementation, validation, and outcome-focused reporting. That matters for e-commerce, B2B, and local service clients, because each one needs a different measurement mix even when the tools overlap.
The team also brings together multiple disciplines, including former Google staff, designers, writers, and analysts, which helps when analytics has to connect to site design, SEO, PPC, email, and conversion rate optimization. A website analytics agency only adds value when it can connect those moving parts, not when it isolates reporting from the rest of the marketing stack. Ascendly’s free consultations and detailed reporting fit that model because they start with goals, then match tactics to the measurement plan.
For a buyer, the useful takeaway is simple. Start with the question you need answered, then decide what has to be measured to answer it. A software purchase won’t do that work on its own. A measurement conversation will.
If you want help turning website data into a reporting system your team can use, Ascendly Marketing can build the measurement structure, the dashboards, and the reporting rhythm around your goals. Start with a conversation about what you need to track, then let the team map the path from traffic to conversions to revenue decisions.