

TL;DR:
- Measurable results help teams align, hold accountability, and learn faster by defining clear metrics and targets. Vague goals lead to misalignment, wasted effort, decision paralysis, and missed opportunities. Regular measurement and focused priorities improve organizational performance and enable better resource allocation.
Prioritize measurable results because they convert strategy into predictable outcomes and give you the evidence to make faster, better decisions. Without a number attached to a goal, you cannot tell whether you’re winning, drifting, or burning resources on the wrong thing.
Here’s what measurable results deliver immediately:
- Alignment: Every team member knows what “done” looks like.
- Accountability: Ownership is unambiguous when a target is specific.
- Learning: You can tell what worked and repeat it.
- Prioritization: Finite resources flow to goals with the clearest return signal.
The rest of this guide gives you practical frameworks, real before/after examples, a prioritization method, and a copyable checklist so you can put measurement to work in your next planning cycle.
Table of Contents
- What breaks when your goals aren’t measurable
- How measurable results improve organizational performance
- What the research actually shows about measurable goals
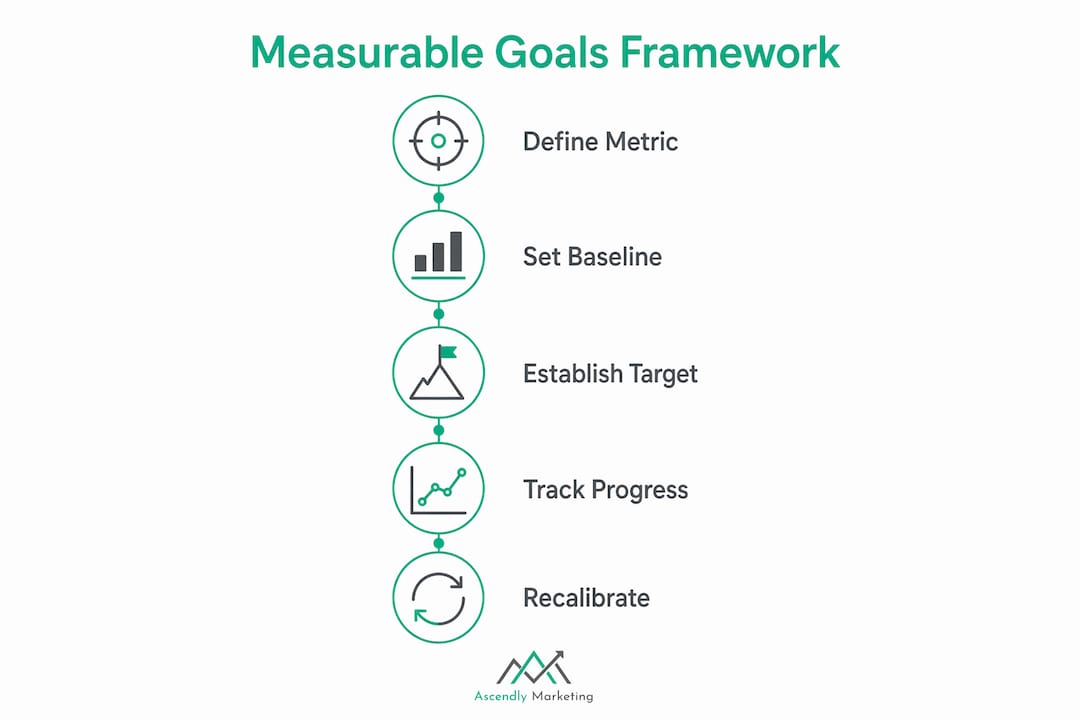
- How to make any goal measurable: a step-by-step framework
- Good vs. bad goal examples across four functions
- How to prioritize measurable results when everything feels urgent
- Measuring progress: cadence, roles, and cost considerations
- Common pitfalls when prioritizing measurable results
- A quick checklist to test whether a goal is truly measurable
- Key Takeaways
- The case for measurement over motion
- Ascendly Marketing helps you build a measurement system that actually works
- Useful sources and further reading
What breaks when your goals aren’t measurable
Vague goals don’t just underperform. They actively waste time and erode trust in the planning process.
The failure modes are predictable:
- Misalignment: Two teams interpret “grow the business” differently and pull in opposite directions.
- Wasted effort: Without a baseline or target, teams optimize for activity (calls made, content published) rather than outcomes (pipeline created, leads converted).
- Decision paralysis: When a quarter ends and results are unclear, leaders argue about whether the goal was met instead of deciding what to do next.
- Missed targets: No measurement means no early warning. Problems surface at the end of the quarter, not in week three when you could still course-correct.
Picture a marketing team told to “increase brand awareness.” Six months later, one person points to social followers, another to press mentions, and a third to website traffic. None of them are wrong, but none of them can tell you whether the company is actually better known. The goal consumed budget and time and produced a debate, not a decision.
Measurable goals solve each of these failures directly: they define the metric, set the baseline, and make the target unambiguous before work begins.

How measurable results improve organizational performance
The benefits aren’t abstract. Each one maps to a specific management action.
Alignment across teams. A shared, specific target forces cross-functional agreement before work starts. When sales and marketing both own “generate 200 qualified leads per month,” there’s no room for conflicting definitions of success.
Clear accountability. Vague goals diffuse ownership. A measurable goal names an owner, a number, and a deadline. That combination makes accountability real rather than implied.
Sharper focus. Teams with specific targets spend less time on low-value activity. The metric acts as a filter: if an action doesn’t move the number, it’s deprioritized.
Faster learning and continuous improvement. When you track outcomes, you accumulate data. That data tells you which tactics worked, which didn’t, and what to try next quarter. Without measurement, you’re repeating guesses.
Better resource allocation. Budget and headcount follow the goals with the clearest evidence of return. Measurement makes that evidence visible.
Autonomy with accountability. Research from MIT Sloan shows that pairing autonomy with measurable outcomes reduced employee turnover and improved engagement in retail case studies. Managers who define the “what” and let teams own the “how” get better results than those who micromanage process.
Prioritization under pressure. When every department has a list of initiatives, measurable goals give you a common currency for comparison. You can rank by expected impact, not by who argued loudest in the planning meeting.
Pro Tip: Measure customer satisfaction monthly as a leading indicator. Past profitability tells you what happened; customer satisfaction predicts what’s coming next.
What the research actually shows about measurable goals
The evidence for measurement isn’t anecdotal. It comes from large-scale studies and decades of management research.
- A study cited by Harvard Business School Online found that 90% of senior executives at companies with $1B+ in annual revenue failed to reach all strategic goals, with poor implementation and a lack of concrete, measurable outcome definitions as the primary causes.
- Research tied to MIT Sloan finds that quarterly check-ins linked to specific goals consistently outperform annual reviews, both for performance and for managers’ ability to address problems before they compound.
- Strategy+Business argues that evidence-based management gives companies a structural competitive advantage by treating ideas as testable hypotheses rather than assumptions.
The implication for managers is direct: if your organization still runs annual planning cycles with vague directional goals, you’re operating at a structural disadvantage. The fix isn’t a new strategy. It’s adding a number, a baseline, and a review date to the goals you already have.
How to make any goal measurable: a step-by-step framework
The SMART framework (Specific, Measurable, Achievable, Relevant, Time-bound) is the right starting point, but it works better when you layer in OKR thinking: separate the objective (the “what”) from the key result (the measurable “how much by when”).
Step-by-step process:
- Define the outcome. What changes in the real world if this goal is achieved? Write it as a result, not an activity.
- Choose the metric. Pick one primary metric that best represents that outcome. Resist the urge to track five things at once.
- Set the baseline. What does the metric read today? You cannot set a meaningful target without knowing where you start.
- Set a tiered target. Use three levels: threshold (minimum acceptable), target (realistic based on historical data), and stretch (ambitious but not demoralizing). Tiered targets sustain engagement and reduce burnout compared to single-point targets.
- Identify a lead indicator. What early signal tells you whether you’re on track before the quarter ends? For a revenue goal, pipeline value is a lead indicator. For a retention goal, engagement scores are.
- Assign an owner. One person is accountable. Others may contribute, but one person answers for the number.
- Set a review cadence. Weekly for operational metrics, monthly for functional goals, quarterly for strategic ones.
Mini template:
Examples:
- Increase monthly qualified leads from 80 to 120 by September 30 via paid search expansion.
- Reduce customer churn rate from 6% to 4% by Q3 via onboarding redesign.
- Increase employee engagement score from 62 to 72 by year-end via manager training program.
A note on outputs vs. outcomes: An output is something you produce (a report, a campaign, a feature). An outcome is a change in behavior or performance that results from it. Always prioritize outcomes. “Launch three email campaigns” is an output. “Increase email-driven revenue from $40K to $55K per month” is an outcome. The ROI calculation only works when you’re measuring outcomes.
Good vs. bad goal examples across four functions
The fastest way to understand measurable goals is to see the rewrite side by side.
| Function | Vague Goal | Measurable Goal | Why It Works |
|---|---|---|---|
| Sales | “Close more deals this quarter” | “Increase closed-won deals from 18 to 25 per month by June 30” | Specific count, baseline, deadline, and owner-assignable |
| Marketing | “Improve brand awareness” | “Increase organic website sessions from 12,000 to 18,000/month by Q3 via SEO” | Trackable in Google Analytics; lead indicator is keyword rankings |
| Product | “Make the product better” | “Reduce average support tickets per user from 1.4 to 0.8 per month by Q4” | Directly tied to product quality; measurable in the support system |
| HR | “Improve employee satisfaction” | “Increase eNPS from 28 to 40 by December 31 via quarterly pulse surveys” | Standardized score, clear baseline, defined measurement method |
A few notes on tracking each:
- The sales goal lives in your CRM. If you’re not using one, that’s the first infrastructure gap to fix.
- The marketing goal requires Google Analytics or a comparable platform. Marketing analytics makes this straightforward for most teams.
- The product goal needs a support ticketing system with per-user data.
- The HR goal requires a consistent survey instrument. eNPS (Employee Net Promoter Score) is the simplest standardized option.
On qualitative context: Some goals resist pure quantification. Brand health, culture, and customer sentiment all have numeric proxies (NPS, eNPS, sentiment scores), but those numbers need qualitative context. A drop in NPS from 52 to 44 means something different if it follows a product outage versus a pricing change. Always pair the number with a brief narrative at review time.
How to prioritize measurable results when everything feels urgent
Not every goal deserves equal attention. When resources are limited, prioritization is the skill that separates good managers from overwhelmed ones.

The rule of thumb: three goals maximum per team per quarter. More than three and focus fragments. Fewer than three and you may be under-investing in growth. Three is the number where accountability stays real, and progress stays visible.
A simple prioritization matrix:
Rank each candidate goal on two dimensions:
- Impact: How much does hitting this goal move a company-level metric (revenue, retention, cost)?
- Effort: How much time, budget, and tooling does measurement and execution require?
Prioritize high-impact, lower-effort goals first. Defer high-effort, low-impact goals until capacity opens up.
Leading vs. lagging indicators by function:
- Sales: Lead indicators are pipeline value and meeting volume. Lagging indicators are closed revenue and win rate.
- Marketing: Lead indicators are traffic, lead volume, and engagement rate. Lagging indicators are revenue attributed and customer acquisition cost.
- Product: Lead indicators are feature adoption and support ticket trends. Lagging indicators are churn rate and NPS.
- HR: Lead indicators are engagement scores and absenteeism. Lagging indicators are turnover rate and time-to-fill.
Prioritize lead indicators for weekly check-ins. They give you time to act. Lagging indicators are the scoreboard; lead indicators are the game film.
Mid-quarter recalibration: When a new signal appears (a competitor move, a market shift, an unexpected result), run a quick three-question check before changing goals: Does this signal change the impact ranking of our current goals? Do we have evidence it’s a trend, not noise? Can we absorb a goal change without losing momentum on what’s already working? If the answer to all three is yes, adjust. Otherwise, hold the line until the quarter ends.
Measuring progress: Cadence, roles, and cost considerations
| Cadence | What to review | Who leads |
|---|---|---|
| Daily | Operational metrics (tickets resolved, leads contacted, uptime) | Team lead or automated dashboard |
| Weekly | Lead indicators (pipeline, traffic, engagement) | Goal owner |
| Monthly | Functional goal progress (lead volume, churn, eNPS) | Manager + goal owner |
| Quarterly | Strategic goal outcomes (revenue, retention, cost targets) | Senior leadership |
Roles during a check-in:
- Owner: Reports the current metric, explains variance from target, and proposes the next action.
- Contributor: Shares what’s working or blocking progress from their area.
- Reviewer: Asks whether the goal is still the right goal, whether resources are adequate, and whether the timeline needs adjustment.
Cost and effort considerations:
Manual data collection is the most common bottleneck. A weekly check-in that requires two hours of spreadsheet work is a check-in that gets skipped. The threshold for automation is simple: if a metric is reviewed more than monthly, automate its collection. Tools like Google Looker Studio, Tableau, or Power BI can pull from most data sources and reduce reporting time from hours to minutes.
For teams just starting, a shared Google Sheet with a weekly update ritual is enough. The goal is consistency, not sophistication. Quarterly check-ins tied to specific goals outperform annual reviews regardless of the tool used to track them.
AI-assisted tools can now process internal and external data to flag when a key result is drifting off track before a human reviewer would notice. For teams managing more than five concurrent goals, that kind of automated alerting is worth the setup time.
Common pitfalls when prioritizing measurable results
Measurement done poorly creates its own problems. Here are the ones that show up most often.
- Optimizing only what’s easy to measure. If you only track what’s in your dashboard, you’ll eventually drift toward activities that look good on a report but don’t move the business. Culture, brand health, and customer sentiment are harder to quantify but matter enormously. Pair KPIs with periodic qualitative check-ins.
- Too many metrics. A team tracking 12 KPIs is tracking none of them seriously. Every metric beyond the top three dilutes attention and creates reporting overhead with no corresponding decision value.
- Perverse incentives. When a metric becomes a target, it can stop being a good measure of the thing you care about. A sales team measured purely on call volume will make more calls and fewer quality conversations.
- Ignoring qualitative signals. A customer satisfaction score of 72 looks fine until you read the open-ended responses and find a pattern of complaints about a specific feature. Numbers without context mislead.
- Metric gaming. Teams sometimes hit a number without achieving the underlying goal. Watch for sudden step-changes in a metric with no corresponding process change. A support team that closes tickets faster but sees no improvement in customer satisfaction scores is likely closing tickets without resolving issues.
Pro Tip: To detect metric gaming, look for a sharp jump in a KPI that isn’t accompanied by a visible process change, a new tool, or a staffing increase. If the number moved but nothing else did, ask why.
Corrective actions:
- Audit your metric list quarterly. Remove any KPI that hasn’t influenced a decision in the past 90 days.
- Add one qualitative data point (a survey, a customer interview, a team retrospective) to every monthly review.
- Separate the metric from the incentive when gaming appears. Measure the outcome, not the proxy.
A quick checklist to test whether a goal is truly measurable
Use this in any goal-setting meeting. If a goal can’t pass all five checks, rewrite it before it gets assigned.
- [ ] Specific metric: Is there a single, named metric that represents success?
- [ ] Baseline: Do you know what the metric reads today?
- [ ] Target: Is there a specific number (or range) the metric needs to reach?
- [ ] Owner: Is one person accountable for reporting and driving the metric?
- [ ] Cadence: Is there a scheduled review date (weekly, monthly, or quarterly)?
Copyable template for goal-tracking docs:
How to use it: At the start of a planning session, write every proposed goal on a whiteboard. Run each one through the five checks. Any goal that fails two or more checks gets rewritten before the meeting ends. Goals that pass all five get assigned. This takes about 10 minutes per goal and prevents weeks of wasted effort downstream.
Key Takeaways
Measurable goals are the single most reliable way to turn strategy into execution: they align teams, surface problems early, and give managers the evidence to allocate resources where they actually matter.
| Point | Details |
|---|---|
| Measurement prevents strategic failure | 90% of senior executives at large companies fail to reach all strategic goals, most often due to poor implementation and vague outcomes. |
| Three goals per team per quarter | Limiting focus to three measurable goals per team per quarter keeps accountability real and prevents attention from fragmenting. |
| Lead indicators beat lagging ones | Prioritize lead indicators (pipeline, engagement, adoption) for weekly check-ins; they give you time to act before the quarter ends. |
| Cadence determines impact | Quarterly check-ins tied to specific goals outperform annual reviews for both performance and early problem detection. |
| Ascendly Marketing applies this directly | Ascendly Marketing builds measurement frameworks into every client engagement, from KPI selection to dashboard setup and quarterly review cycles. |
The case for measurement over motion
Most organizations don’t have a strategy problem. They have a measurement problem dressed up as a strategy problem.
The pattern is familiar: a leadership team spends two days offsite crafting a compelling vision, returns with a slide deck full of directional statements, and then watches the next quarter unfold exactly as the last one did. The vision was fine. The missing piece was the translation layer between aspiration and daily work, and that layer is built from measurable goals.
What’s underappreciated is that measurement isn’t primarily a control mechanism. It’s a communication tool. When a manager defines a goal with a specific metric, a baseline, and a target, they’re not micromanaging. They’re giving their team the clearest possible picture of what success looks like and then getting out of the way. That’s the autonomy-with-accountability model that MIT Sloan research links to lower turnover and higher engagement.
The other thing most articles miss: the act of trying to quantify a goal is itself valuable, even when the data doesn’t exist yet. When a team writes “data not available” next to a metric in a review, that gap becomes visible. Someone owns fixing it. Within a quarter, you have data you didn’t have before. The process of measurement builds the infrastructure for better measurement.
The managers who resist this usually cite one of two concerns: “We’ll optimize for the wrong things” or “Measurement kills creativity.” Both are real risks, and both are solved by the same thing: pairing quantitative targets with qualitative context, and auditing your metric list regularly to make sure you’re still measuring what matters. The answer to bad measurement isn’t no measurement. It’s better measurement.
Ascendly Marketing helps you build a measurement system that actually works
Most teams know they should be tracking results more rigorously. The gap is usually not knowledge; it’s setup time, tool selection, and the discipline to hold a consistent review cadence.

Ascendly Marketing works with small and mid-sized businesses to build the measurement infrastructure their strategies need: KPI selection tied to business goals, dashboard setup that pulls from your existing data sources, and a 90-day results plan that establishes a review rhythm your team will actually follow. The work is grounded in the same frameworks covered in this guide, applied to your specific goals, channels, and growth stage. For businesses running paid advertising or SEO campaigns, that means connecting channel metrics directly to revenue outcomes, not just traffic or impression counts.
If you’re ready to move from directional goals to measurable ones, see how Ascendly Marketing structures that process for businesses like yours.
Useful sources and further reading
- Business Goals and Objectives (Harvard Business School Online) — The source for the 90% strategic failure statistic; useful for internal conversations about why measurement matters at scale.
- How to Get Real About Measuring to Outcomes (MIT Sloan Management Review) — Practitioner-focused research on autonomy, accountability, and results-only work approaches.
- Perception of the Transformation (MIT / Academic Paper) — Research on quarterly check-ins and performance management cadence.
- Why Managing by Facts Works (Strategy+Business) — The case for evidence-based management and treating strategy as a testable hypothesis.
- What Gets Measured Gets Done (Tom Peters) — The foundational argument for measurement as a management discipline, with the feedback-and-reward extension.
- The Science of Achievable Targets (JLytics) — Research on tiered target structures (threshold, target, stretch) and their effect on sustained performance.
- Setting Data-Driven Goals (DrSoftwareServices) — Practical guidance on grounding targets in historical performance data.
- Short and Long-Term Goals and KPIs (Business Queensland) — Government-sourced guidance on SMART goals and KPI monitoring cadence; useful for teams building their first measurement framework.
- Measurable ROI Explained (Ascendly Marketing) — Ascendly Marketing’s guide to quantifying marketing outcomes and proving campaign value.
- Why Measure Marketing ROI (Ascendly Marketing) — Practical SMB-focused guidance on measuring marketing outcomes, including cost and time tradeoffs.